org.apache.flink.runtime.io.network.NetworkEnvironment causing memory leak?

classic Classic list List threaded Threaded
7 messages Options
Reply | Threaded
Open this post in threaded view
|

org.apache.flink.runtime.io.network.NetworkEnvironment causing memory leak?

Hao Sun
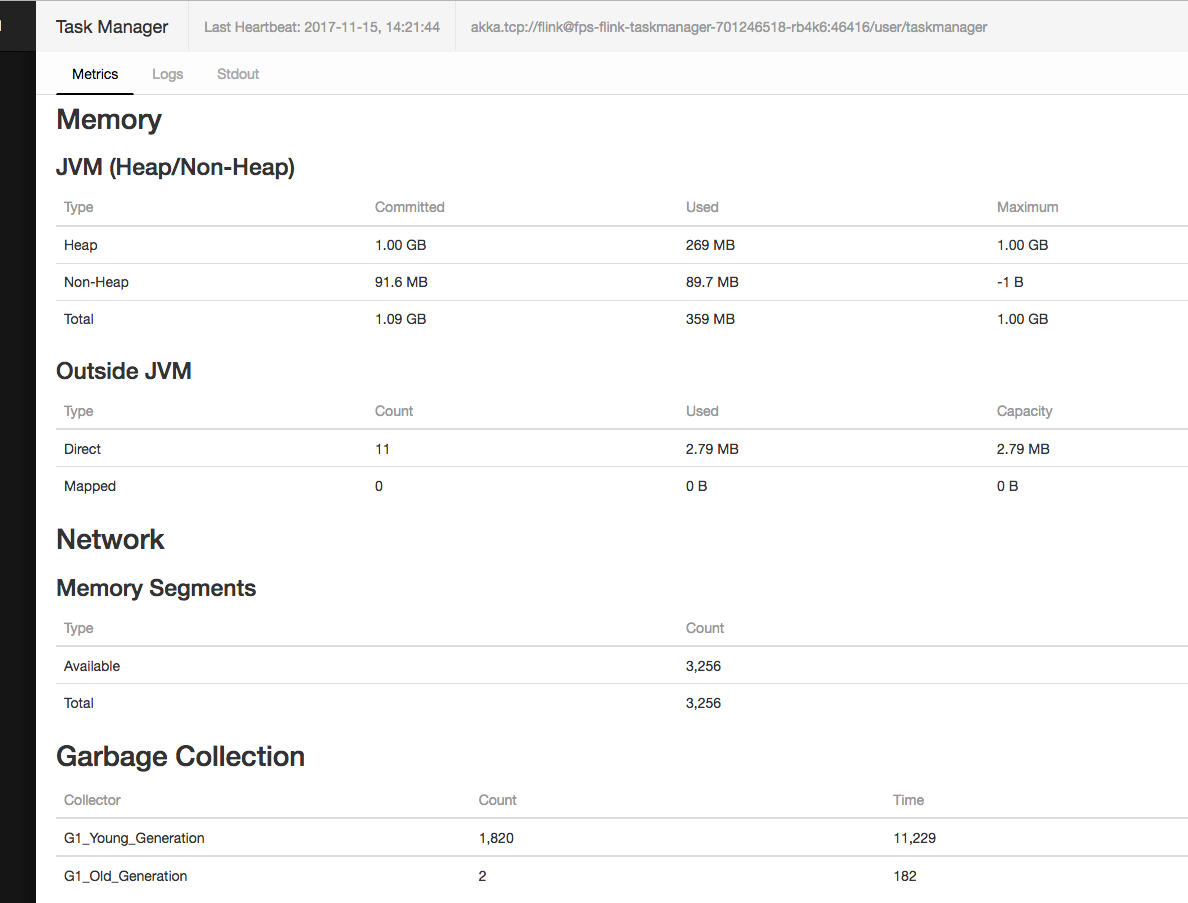
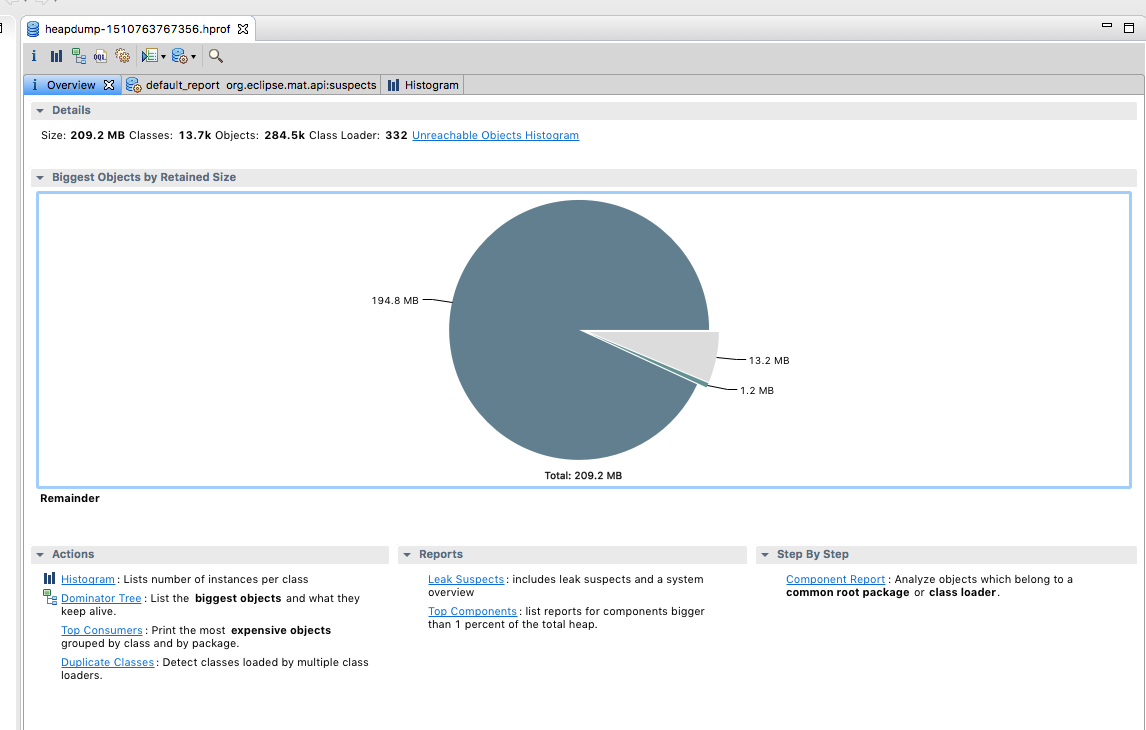
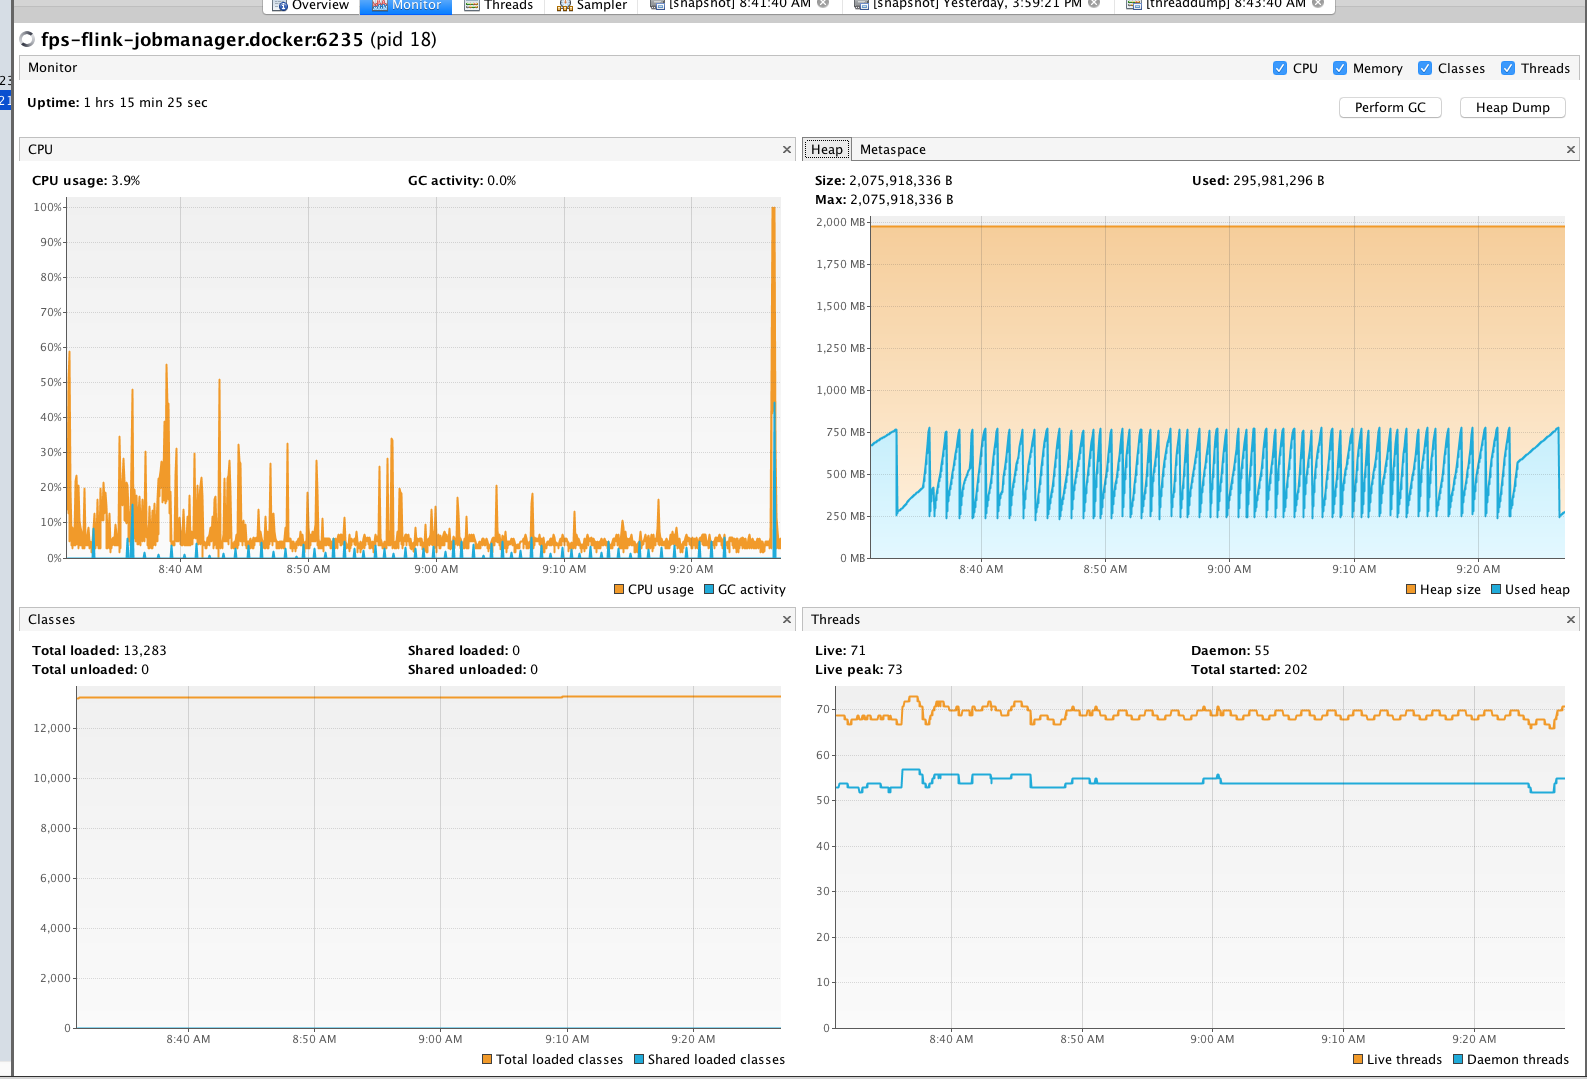
Hi team, I am looking at some memory/GC issues for my flink setup. I am running flink 1.3.2 in docker for my development environment. Using Kubernetes for production.
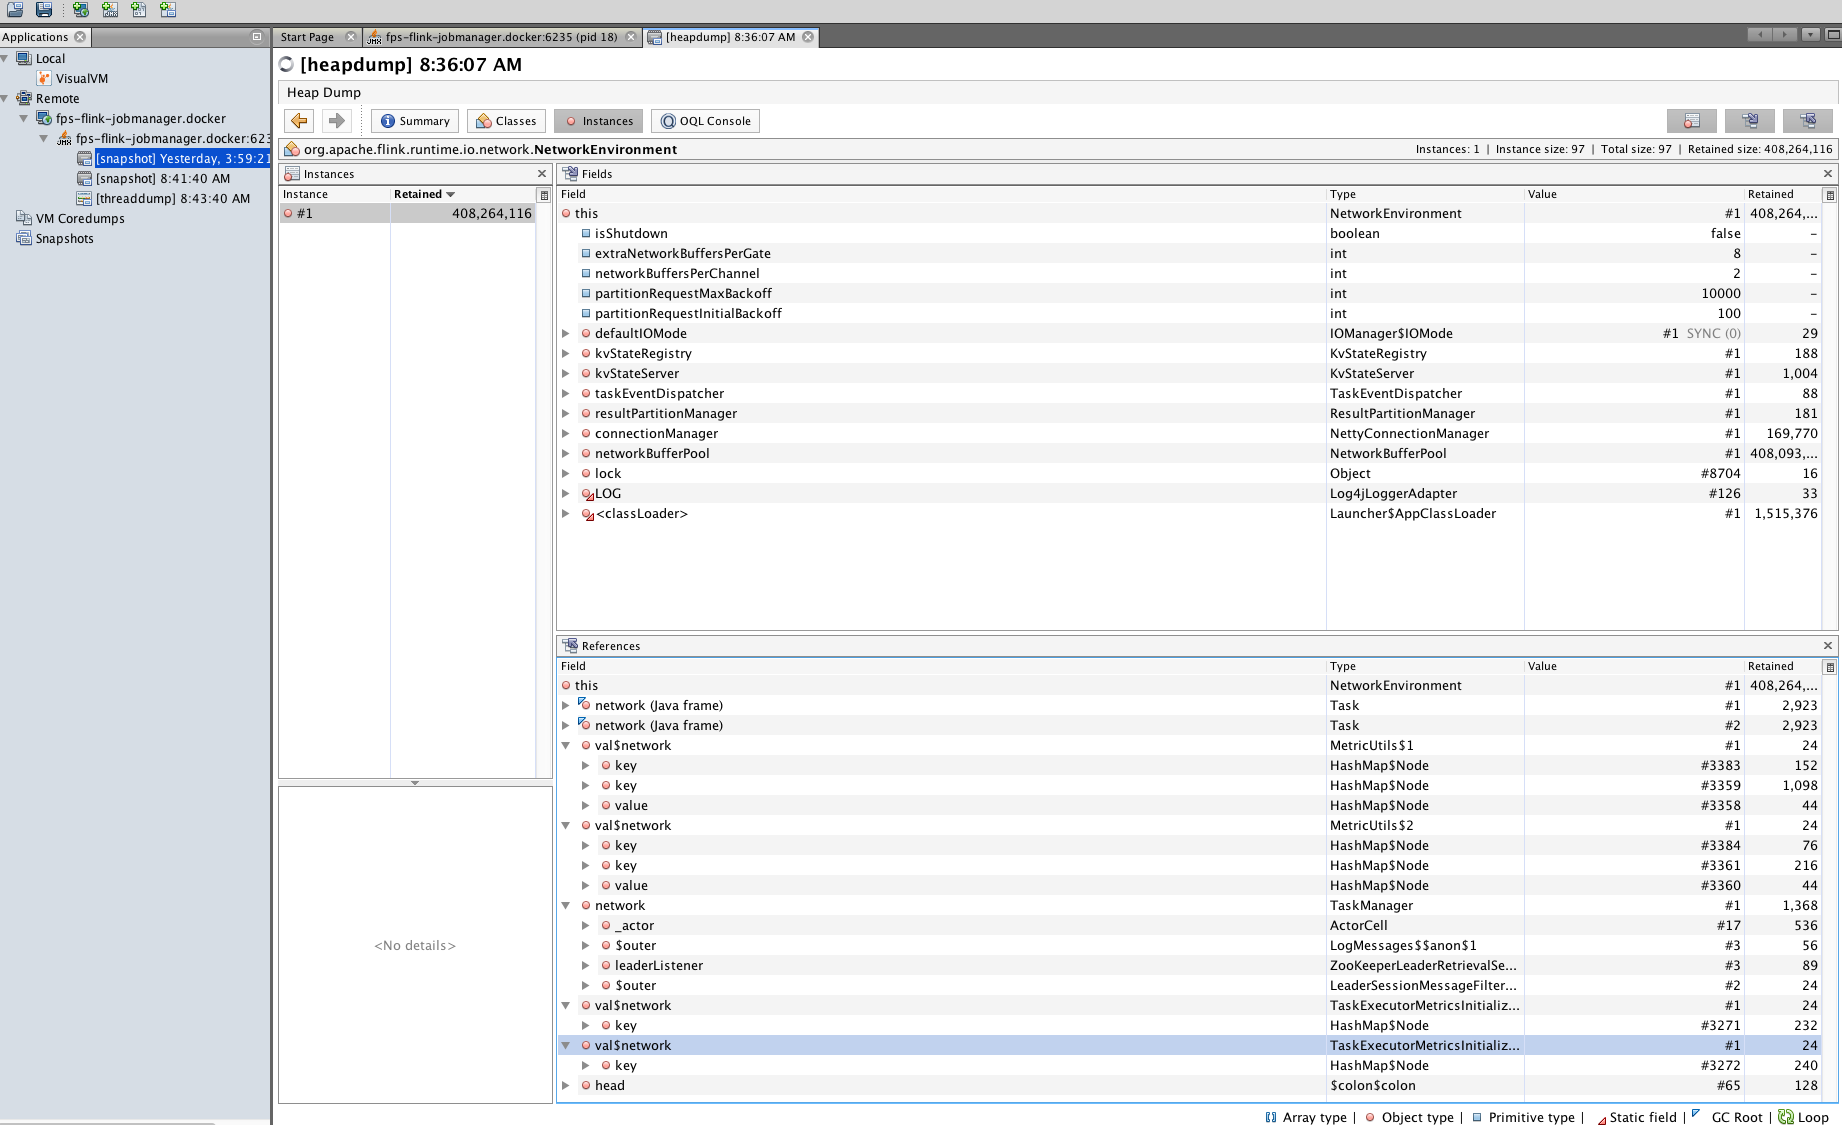
I see instances of org.apache.flink.runtime.io.network.NetworkEnvironment are increasing dramatically and not GC-ed very well for my application.
My simple app collects Kafka events and transforms the information and logs the results out.

Is this expected? I am new to Java memory analysis not sure what is actually wrong.

image.png
image.png
image.png
image.png
Reply | Threaded
Open this post in threaded view
|

Re: org.apache.flink.runtime.io.network.NetworkEnvironment causing memory leak?

Hao Sun
FYI this is why I think there is a memory leak somewhere. G1_Young_Gen kept growing and time spend kept increasing

image.png


On Wed, Nov 15, 2017 at 9:35 AM Hao Sun <[hidden email]> wrote:
Hi team, I am looking at some memory/GC issues for my flink setup. I am running flink 1.3.2 in docker for my development environment. Using Kubernetes for production.
I see instances of org.apache.flink.runtime.io.network.NetworkEnvironment are increasing dramatically and not GC-ed very well for my application.
My simple app collects Kafka events and transforms the information and logs the results out.

Is this expected? I am new to Java memory analysis not sure what is actually wrong.
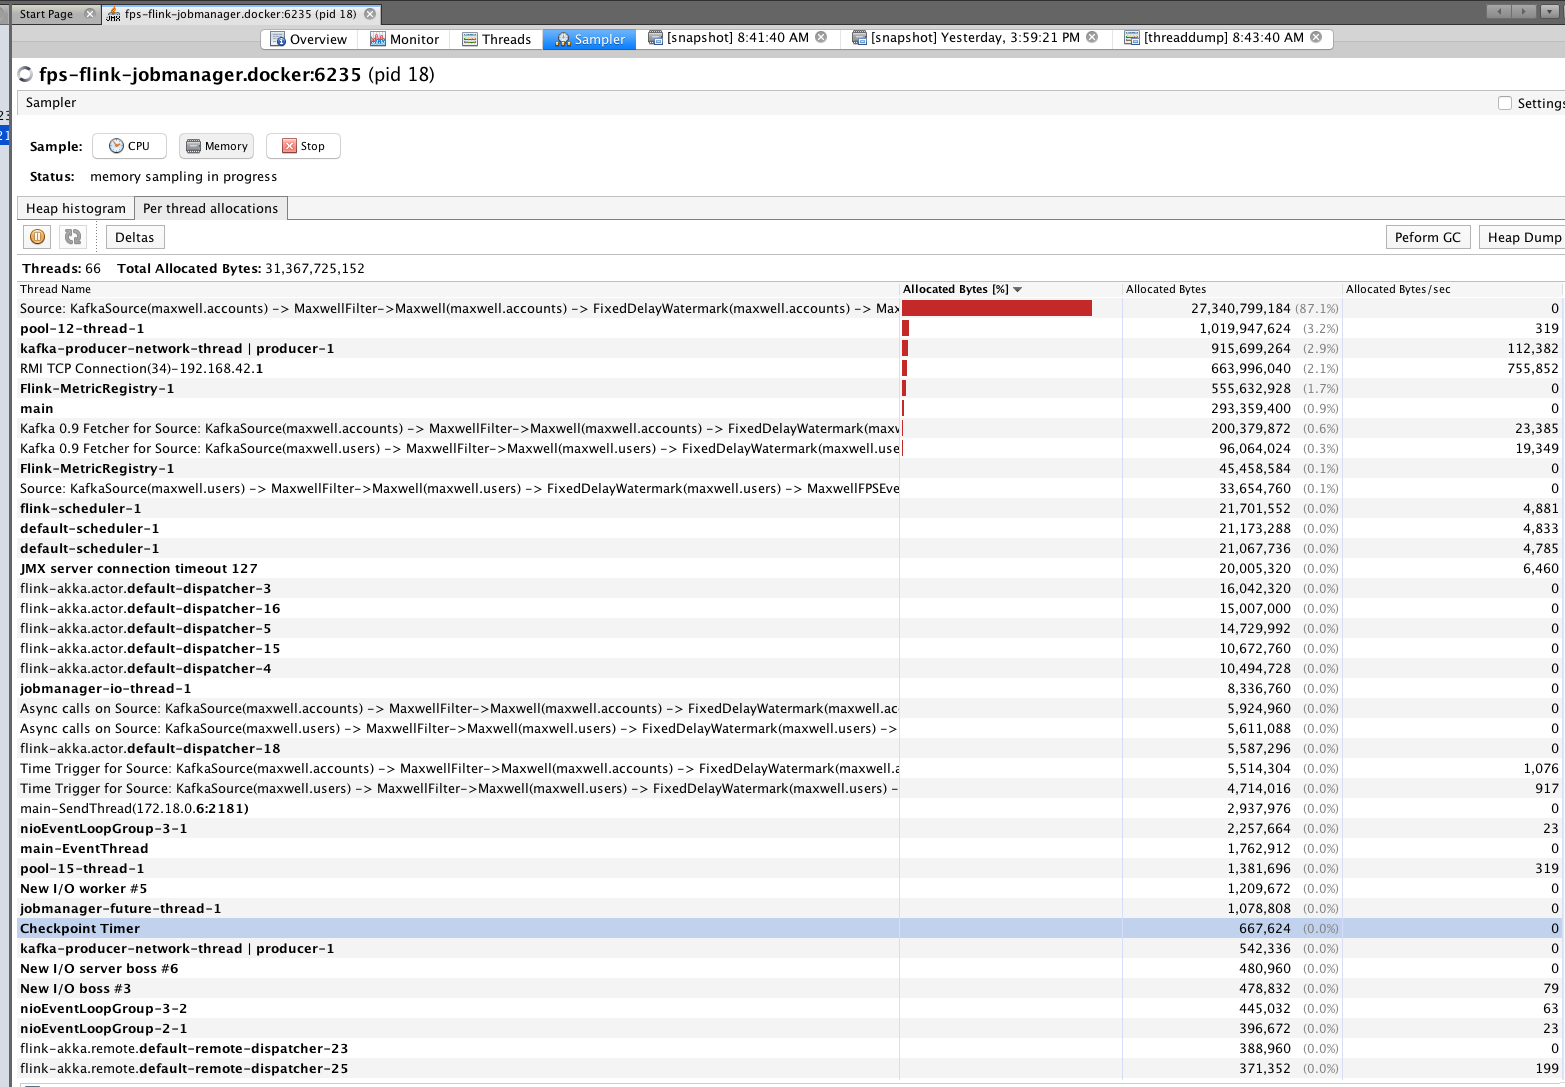
image.png
image.png
image.png
image.png
Reply | Threaded
Open this post in threaded view
|

Re: org.apache.flink.runtime.io.network.NetworkEnvironment causing memory leak?

Stefan Richter
In reply to this post by Hao Sun
Hi,

I cannot spot anything that indicates a leak from your screenshots. Maybe you misinterpret the numbers? In your heap dump, there is only a single instance of org.apache.flink.runtime.io.network.NetworkEnvironment and it retains about 400,000,000 bytes from being GCed because it holds references to the network buffers. This is perfectly normal because this the buffer pool is part of this object, and for as long as it lives, the referenced buffers should not be GCed and the current size of all your buffers is around 400 million bytes.

Your heap space is also not growing without bounds, but always goes down after a GC was performed. Looks fine to me.

Last, I think the number of G1_Young_Generation is a counter of how many gc cycles have been performed and the time is a sum. So naturally, those values would always increase.

Best,
Stefan

> Am 15.11.2017 um 18:35 schrieb Hao Sun <[hidden email]>:
>
> Hi team, I am looking at some memory/GC issues for my flink setup. I am running flink 1.3.2 in docker for my development environment. Using Kubernetes for production.
> I see instances of org.apache.flink.runtime.io.network.NetworkEnvironment are increasing dramatically and not GC-ed very well for my application.
> My simple app collects Kafka events and transforms the information and logs the results out.
>
> Is this expected? I am new to Java memory analysis not sure what is actually wrong.
>
> <image.png>
> <image.png>
> <image.png>
> <image.png>

Reply | Threaded
Open this post in threaded view
|

Re: org.apache.flink.runtime.io.network.NetworkEnvironment causing memory leak?

Hao Sun

Thanks a lot! This is very helpful.
In addition to your comments, what are the items retained by NetworkEnvironment? They grew seems like indefinitely, do they ever reduce?

I think there is a GC issue because my task manager is killed somehow after a job run. The duration correlates to the volume of Kafka topics. More volume TM dies quickly. Do you have any tips to debug it?


On Thu, Nov 16, 2017, 01:35 Stefan Richter <[hidden email]> wrote:
Hi,

I cannot spot anything that indicates a leak from your screenshots. Maybe you misinterpret the numbers? In your heap dump, there is only a single instance of org.apache.flink.runtime.io.network.NetworkEnvironment and it retains about 400,000,000 bytes from being GCed because it holds references to the network buffers. This is perfectly normal because this the buffer pool is part of this object, and for as long as it lives, the referenced buffers should not be GCed and the current size of all your buffers is around 400 million bytes.

Your heap space is also not growing without bounds, but always goes down after a GC was performed. Looks fine to me.

Last, I think the number of G1_Young_Generation is a counter of how many gc cycles have been performed and the time is a sum. So naturally, those values would always increase.

Best,
Stefan

> Am 15.11.2017 um 18:35 schrieb Hao Sun <[hidden email]>:
>
> Hi team, I am looking at some memory/GC issues for my flink setup. I am running flink 1.3.2 in docker for my development environment. Using Kubernetes for production.
> I see instances of org.apache.flink.runtime.io.network.NetworkEnvironment are increasing dramatically and not GC-ed very well for my application.
> My simple app collects Kafka events and transforms the information and logs the results out.
>
> Is this expected? I am new to Java memory analysis not sure what is actually wrong.
>
> <image.png>
> <image.png>
> <image.png>
> <image.png>

Reply | Threaded
Open this post in threaded view
|

Re: org.apache.flink.runtime.io.network.NetworkEnvironment causing memory leak?

Stefan Richter
Hi,

In addition to your comments, what are the items retained by NetworkEnvironment? They grew seems like indefinitely, do they ever reduce?


Mostly the network buffers, which should be ok. They are always recycled and should not be released until the network environment is GCed.

I think there is a GC issue because my task manager is killed somehow after a job run. The duration correlates to the volume of Kafka topics. More volume TM dies quickly. Do you have any tips to debug it?

What killed your task manager? For example do you see a see an java.lang.OutOfMemoryError or is the process killed by the OS’s OOM killer? In case of an OOM killer, you might need to grant more process memory or reduce the memory that you have configured for Flink to stay below the configured threshold that would kill the process. What exactly do you mean by „volume“ of Kafka topics? 

To debug, I suggest that you first figure out why the process is killed, maybe your thresholds are simply to low and the consumption can go beyond with your configuration of Flink. Then you should figure out what is actually growing more than you expect, e.g. is the problem triggered by heap space or native memory? Depending on the answer, e.g. heap dumps could help to spot the problematic objects.

Best,
Stefan
Reply | Threaded
Open this post in threaded view
|

Re: org.apache.flink.runtime.io.network.NetworkEnvironment causing memory leak?

Hao Sun
Sorry, the "killed" I mean here is JM lost the TM. The TM instance is still running inside kubernetes, but it is not responding to any requests, probably due to high load. And from JM side, JM lost heartbeat tracking of the TM, so it marked the TM as died.

The „volume“ of Kafka topics, I mean, the volume of messages for a topic. e.g. 10000 msg/sec, I have not check the size of the message yet.
But overall, as you suggested, I think I need more tuning for my TM params, so it can maintain a reasonable load. I am not sure what params to look for, but I will do my research first.

Always thanks for your help Stefan.

On Thu, Nov 16, 2017 at 8:27 AM Stefan Richter <[hidden email]> wrote:
Hi,

In addition to your comments, what are the items retained by NetworkEnvironment? They grew seems like indefinitely, do they ever reduce?


Mostly the network buffers, which should be ok. They are always recycled and should not be released until the network environment is GCed.

I think there is a GC issue because my task manager is killed somehow after a job run. The duration correlates to the volume of Kafka topics. More volume TM dies quickly. Do you have any tips to debug it?

What killed your task manager? For example do you see a see an java.lang.OutOfMemoryError or is the process killed by the OS’s OOM killer? In case of an OOM killer, you might need to grant more process memory or reduce the memory that you have configured for Flink to stay below the configured threshold that would kill the process. What exactly do you mean by „volume“ of Kafka topics? 

To debug, I suggest that you first figure out why the process is killed, maybe your thresholds are simply to low and the consumption can go beyond with your configuration of Flink. Then you should figure out what is actually growing more than you expect, e.g. is the problem triggered by heap space or native memory? Depending on the answer, e.g. heap dumps could help to spot the problematic objects.

Best,
Stefan
Reply | Threaded
Open this post in threaded view
|

Re: org.apache.flink.runtime.io.network.NetworkEnvironment causing memory leak?

Piotr Nowojski
Hi,

If the TM is not responding check the TM logs if there is some long gap in logs. There might be three main reasons for such gaps:

1. Machine is swapping - setup/configure your machine/processes that machine never swap (best to disable swap altogether)
2. Long GC full stops - look how to analyse those either by printing GC logs or attaching to the JVM with some profiler.
3. Network issues - but this usually shouldn’t cause gaps in the logs.

Piotrek

On 16 Nov 2017, at 17:48, Hao Sun <[hidden email]> wrote:

Sorry, the "killed" I mean here is JM lost the TM. The TM instance is still running inside kubernetes, but it is not responding to any requests, probably due to high load. And from JM side, JM lost heartbeat tracking of the TM, so it marked the TM as died.

The „volume“ of Kafka topics, I mean, the volume of messages for a topic. e.g. 10000 msg/sec, I have not check the size of the message yet.
But overall, as you suggested, I think I need more tuning for my TM params, so it can maintain a reasonable load. I am not sure what params to look for, but I will do my research first.

Always thanks for your help Stefan.

On Thu, Nov 16, 2017 at 8:27 AM Stefan Richter <[hidden email]> wrote:
Hi,

In addition to your comments, what are the items retained by NetworkEnvironment? They grew seems like indefinitely, do they ever reduce?


Mostly the network buffers, which should be ok. They are always recycled and should not be released until the network environment is GCed.

I think there is a GC issue because my task manager is killed somehow after a job run. The duration correlates to the volume of Kafka topics. More volume TM dies quickly. Do you have any tips to debug it?

What killed your task manager? For example do you see a see an java.lang.OutOfMemoryError or is the process killed by the OS’s OOM killer? In case of an OOM killer, you might need to grant more process memory or reduce the memory that you have configured for Flink to stay below the configured threshold that would kill the process. What exactly do you mean by „volume“ of Kafka topics? 

To debug, I suggest that you first figure out why the process is killed, maybe your thresholds are simply to low and the consumption can go beyond with your configuration of Flink. Then you should figure out what is actually growing more than you expect, e.g. is the problem triggered by heap space or native memory? Depending on the answer, e.g. heap dumps could help to spot the problematic objects.

Best,
Stefan