help understand/debug high memory footprint on jobmanager

classic Classic list List threaded Threaded
6 messages Options
Reply | Threaded
Open this post in threaded view
|

help understand/debug high memory footprint on jobmanager

Steven Wu
First, some context about the job
* embarrassingly parallel: all operators are chained together
* parallelism is over 1,000
* stateless except for Kafka source operators. checkpoint size is 8.4 MB.
* set "state.backend.fs.memory-threshold" so that only jobmanager writes to S3 to checkpoint
* internal checkpoint with 10 checkpoints retained in history

We don't expect jobmanager to use much memory at all. But it seems that this high memory footprint (or leak) happened occasionally, maybe under certain conditions. Any hypothesis?

Thanks,
Steven


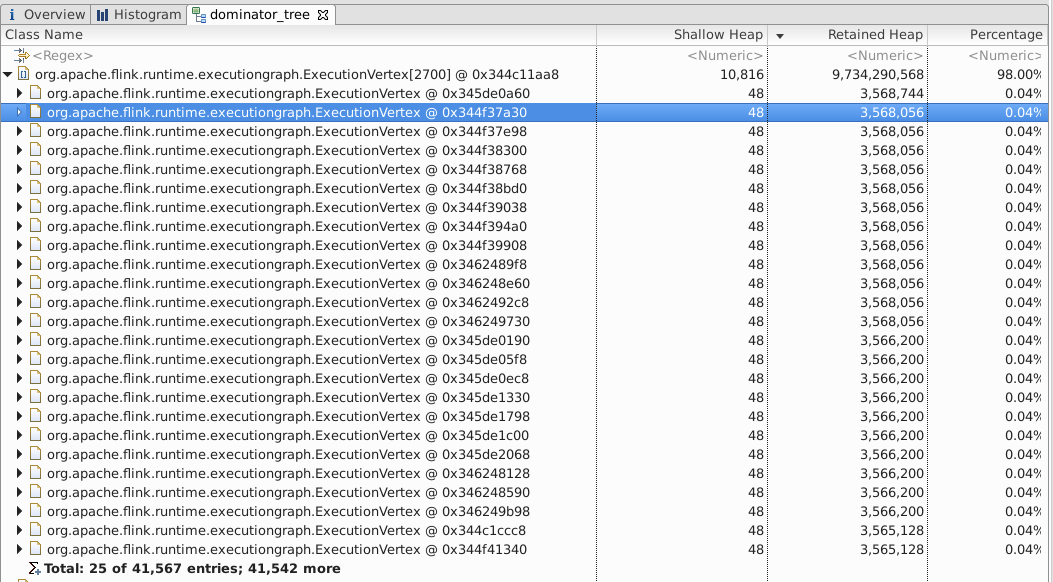
41,567 ExecutionVertex objects retained 9+ GB of memory


Expanded in one ExecutionVertex. it seems to storing the kafka offsets for source operator


Reply | Threaded
Open this post in threaded view
|

Re: help understand/debug high memory footprint on jobmanager

Timo Walther
Hi Steven,

maybe Till in CC has an idea. Which Flink version are you using? Are you using the new FLIP-6 deployment that comes with Flink 1.5?

Regards,
Timo


Am 29.06.18 um 01:29 schrieb Steven Wu:
First, some context about the job
* embarrassingly parallel: all operators are chained together
* parallelism is over 1,000
* stateless except for Kafka source operators. checkpoint size is 8.4 MB.
* set "state.backend.fs.memory-threshold" so that only jobmanager writes to S3 to checkpoint
* internal checkpoint with 10 checkpoints retained in history

We don't expect jobmanager to use much memory at all. But it seems that this high memory footprint (or leak) happened occasionally, maybe under certain conditions. Any hypothesis?

Thanks,
Steven


41,567 ExecutionVertex objects retained 9+ GB of memory


Expanded in one ExecutionVertex. it seems to storing the kafka offsets for source operator


Reply | Threaded
Open this post in threaded view
|

Re: help understand/debug high memory footprint on jobmanager

Stefan Richter
In reply to this post by Steven Wu
Hi Steven,

from your analysis, I would conclude the following problem. ExecutionVertexes hold executions, which are bootstrapped with the state (in form of the map of state handles) when the job is initialized from a checkpoint/savepoint. It holds a reference on this state, even when the task is already running. I would assume it is save to set the reference to TaskStateSnapshot to null at the end of the deploy() method and can be GC’ed. From the provided stats, I cannot say if maybe the JM is also holding references to too many ExecutionVertexes, but that would be a different story.

Best,
Stefan

Am 29.06.2018 um 01:29 schrieb Steven Wu <[hidden email]>:

First, some context about the job
* embarrassingly parallel: all operators are chained together
* parallelism is over 1,000
* stateless except for Kafka source operators. checkpoint size is 8.4 MB.
* set "state.backend.fs.memory-threshold" so that only jobmanager writes to S3 to checkpoint
* internal checkpoint with 10 checkpoints retained in history

We don't expect jobmanager to use much memory at all. But it seems that this high memory footprint (or leak) happened occasionally, maybe under certain conditions. Any hypothesis?

Thanks,
Steven


41,567 ExecutionVertex objects retained 9+ GB of memory
<image.png>


Expanded in one ExecutionVertex. it seems to storing the kafka offsets for source operator
<image.png>


Reply | Threaded
Open this post in threaded view
|

Re: help understand/debug high memory footprint on jobmanager

Stephan Ewen
The problem seems to be that the Executions that are kept for history (mainly metrics / web UI) still hold a reference to their TaskStateSnapshot.

Upon archival, that field needs to be cleared for GC.

This is quite clearly a bug...

On Fri, Jun 29, 2018 at 11:29 AM, Stefan Richter <[hidden email]> wrote:
Hi Steven,

from your analysis, I would conclude the following problem. ExecutionVertexes hold executions, which are bootstrapped with the state (in form of the map of state handles) when the job is initialized from a checkpoint/savepoint. It holds a reference on this state, even when the task is already running. I would assume it is save to set the reference to TaskStateSnapshot to null at the end of the deploy() method and can be GC’ed. From the provided stats, I cannot say if maybe the JM is also holding references to too many ExecutionVertexes, but that would be a different story.

Best,
Stefan

Am 29.06.2018 um 01:29 schrieb Steven Wu <[hidden email]>:

First, some context about the job
* embarrassingly parallel: all operators are chained together
* parallelism is over 1,000
* stateless except for Kafka source operators. checkpoint size is 8.4 MB.
* set "state.backend.fs.memory-threshold" so that only jobmanager writes to S3 to checkpoint
* internal checkpoint with 10 checkpoints retained in history

We don't expect jobmanager to use much memory at all. But it seems that this high memory footprint (or leak) happened occasionally, maybe under certain conditions. Any hypothesis?

Thanks,
Steven


41,567 ExecutionVertex objects retained 9+ GB of memory
<image.png>


Expanded in one ExecutionVertex. it seems to storing the kafka offsets for source operator
<image.png>


Reply | Threaded
Open this post in threaded view
|

Re: help understand/debug high memory footprint on jobmanager

Stephan Ewen
Just saw Stefan's response, it is basically the same.

We either null out the field on deploy or archival. On deploy would be even more memory friendly.

@Steven - can you open a JIRA ticket for this?

On Fri, Jun 29, 2018 at 9:08 PM, Stephan Ewen <[hidden email]> wrote:
The problem seems to be that the Executions that are kept for history (mainly metrics / web UI) still hold a reference to their TaskStateSnapshot.

Upon archival, that field needs to be cleared for GC.

This is quite clearly a bug...

On Fri, Jun 29, 2018 at 11:29 AM, Stefan Richter <[hidden email]> wrote:
Hi Steven,

from your analysis, I would conclude the following problem. ExecutionVertexes hold executions, which are bootstrapped with the state (in form of the map of state handles) when the job is initialized from a checkpoint/savepoint. It holds a reference on this state, even when the task is already running. I would assume it is save to set the reference to TaskStateSnapshot to null at the end of the deploy() method and can be GC’ed. From the provided stats, I cannot say if maybe the JM is also holding references to too many ExecutionVertexes, but that would be a different story.

Best,
Stefan

Am 29.06.2018 um 01:29 schrieb Steven Wu <[hidden email]>:

First, some context about the job
* embarrassingly parallel: all operators are chained together
* parallelism is over 1,000
* stateless except for Kafka source operators. checkpoint size is 8.4 MB.
* set "state.backend.fs.memory-threshold" so that only jobmanager writes to S3 to checkpoint
* internal checkpoint with 10 checkpoints retained in history

We don't expect jobmanager to use much memory at all. But it seems that this high memory footprint (or leak) happened occasionally, maybe under certain conditions. Any hypothesis?

Thanks,
Steven


41,567 ExecutionVertex objects retained 9+ GB of memory
<image.png>


Expanded in one ExecutionVertex. it seems to storing the kafka offsets for source operator
<image.png>


Reply | Threaded
Open this post in threaded view
|

Re: help understand/debug high memory footprint on jobmanager

Steven Wu
Thanks everyone for jumping in. BTW, we are using flink-1.4.1. deployment is stand-alone mode.


On Fri, Jun 29, 2018 at 12:09 PM, Stephan Ewen <[hidden email]> wrote:
Just saw Stefan's response, it is basically the same.

We either null out the field on deploy or archival. On deploy would be even more memory friendly.

@Steven - can you open a JIRA ticket for this?

On Fri, Jun 29, 2018 at 9:08 PM, Stephan Ewen <[hidden email]> wrote:
The problem seems to be that the Executions that are kept for history (mainly metrics / web UI) still hold a reference to their TaskStateSnapshot.

Upon archival, that field needs to be cleared for GC.

This is quite clearly a bug...

On Fri, Jun 29, 2018 at 11:29 AM, Stefan Richter <[hidden email]> wrote:
Hi Steven,

from your analysis, I would conclude the following problem. ExecutionVertexes hold executions, which are bootstrapped with the state (in form of the map of state handles) when the job is initialized from a checkpoint/savepoint. It holds a reference on this state, even when the task is already running. I would assume it is save to set the reference to TaskStateSnapshot to null at the end of the deploy() method and can be GC’ed. From the provided stats, I cannot say if maybe the JM is also holding references to too many ExecutionVertexes, but that would be a different story.

Best,
Stefan

Am 29.06.2018 um 01:29 schrieb Steven Wu <[hidden email]>:

First, some context about the job
* embarrassingly parallel: all operators are chained together
* parallelism is over 1,000
* stateless except for Kafka source operators. checkpoint size is 8.4 MB.
* set "state.backend.fs.memory-threshold" so that only jobmanager writes to S3 to checkpoint
* internal checkpoint with 10 checkpoints retained in history

We don't expect jobmanager to use much memory at all. But it seems that this high memory footprint (or leak) happened occasionally, maybe under certain conditions. Any hypothesis?

Thanks,
Steven


41,567 ExecutionVertex objects retained 9+ GB of memory
<image.png>


Expanded in one ExecutionVertex. it seems to storing the kafka offsets for source operator
<image.png>