Re: Checkpointing with RocksDB as statebackend
Re: Checkpointing with RocksDB as statebackend
|
Hi Xiaogang, Thank you for your inputs. Yes I have already tried setting MaxBackgroundFlushes and MaxBackgroundCompactions to higher value (tried with 2, 4, 8) , still not getting expected results. System.getProperty("java.io. Regards, Vinay Patil On Mon, Feb 20, 2017 at 7:32 AM, xiaogang.sxg [via Apache Flink User Mailing List archive.] <[hidden email]> wrote:
|
Re: Checkpointing with RocksDB as statebackend
|
Hi Vinay! Can you start by giving us a bit of an environment spec? - What Flink version are you using? - What is your rough topology (what operations does the program use) - Where is the state (windows, keyBy)? - What is the rough size of your checkpoints and where does the time go? Can you attach a screenshot from https://ci.apache.org/projects/flink/flink-docs-release-1.2/monitoring/checkpoint_monitoring.html - What is the size of the JVM? Those things would be helpful to know... Best, Stephan On Mon, Feb 20, 2017 at 7:04 PM, vinay patil <[hidden email]> wrote:
|
Re: Checkpointing with RocksDB as statebackend
|
@Vinay!
Just saw the screenshot you attached to the first mail. The checkpoint that failed came after one that had an incredible heavy alignment phase (14 GB). I think that working that off threw the next checkpoint because the workers were still working off the alignment backlog. I think you can for now fix this by setting the minimum pause between checkpoints a bit higher (it is probably set a bit too small for the state of your application). Also, can you describe what your sources are (Kafka / Kinesis or file system)? BTW: We are currently working on - incremental RocksDB checkpoints - the network stack to allow in the future for a new way of doing the alignment Both of that should help that the program is more resilient to these situations. Best, Stephan On Mon, Feb 20, 2017 at 7:51 PM, Stephan Ewen <[hidden email]> wrote:
|
Re: Checkpointing with RocksDB as statebackend
|
In reply to this post by Stephan Ewen
Hi Stephan,
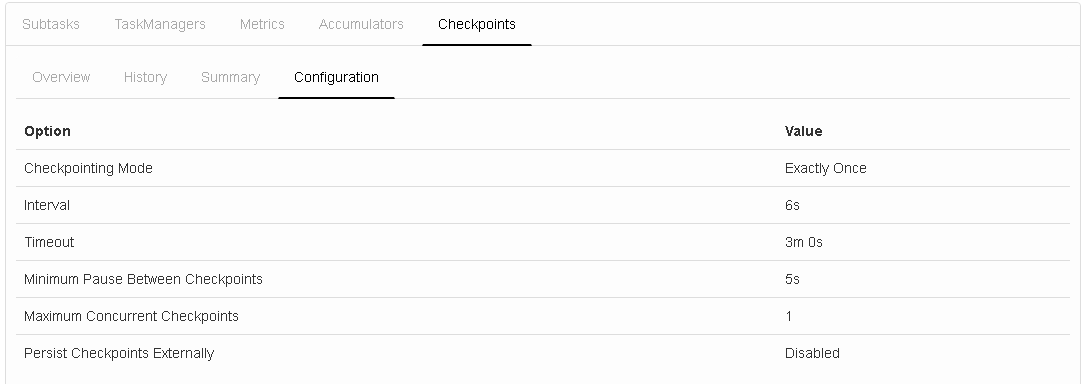
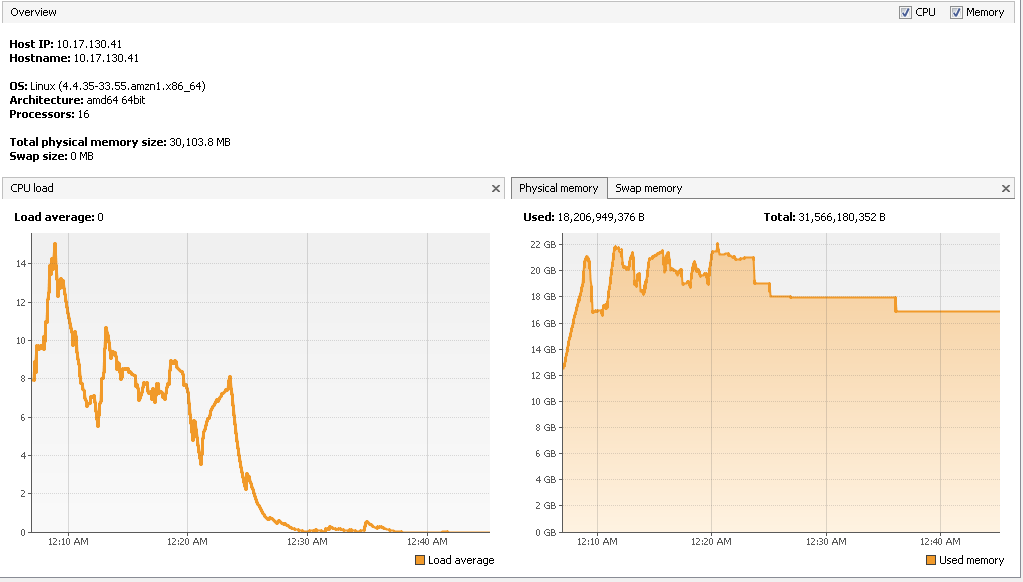
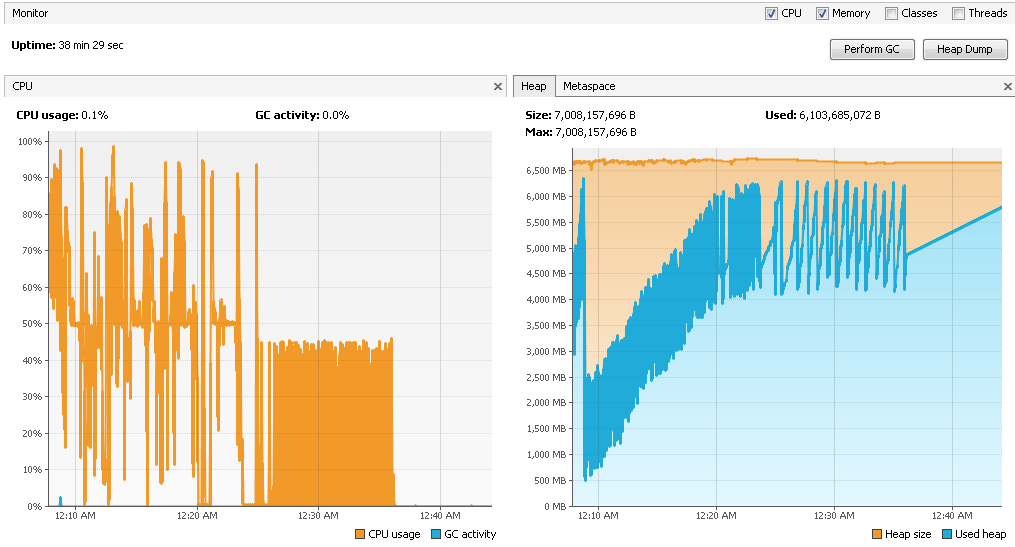
I am using Flink 1.2.0 version, and running the job on on YARN using c3.4xlarge EC2 instances having 16 cores and 30GB RAM each. In total I have set 32 slots and alloted 1200 network buffers I have attached the latest checkpointing snapshot, its configuration, cpu load average ,physical memory usage and heap memory usage here:     Before I describe the topology I want to let you know that when I enabled object reuse, 32M records (total 64M - two kafka source ) were processed in 17minutes , I did not see much halt in between , how does the object reuse help here , I have used FLASH_SSD_OPTIMIZED option ? This is the best result I have got till now (earlier time was 1hr 3minutes). But I don't understand how did it work ? :) The program use the following operations: 1. Consume Data from two kafka sources 2. Extract the information from the record (flatmap) 3. Write as is data to S3 (sink) 4. Union both the streams and apply tumbling window on it to perform outer join (keyBy->window->apply) 5. Some other operators downstream to enrich the data (map->flatMap->map) 6. Write the enriched data to S3 (sink) I have allocated 8GB of heap space to each TM (find the 4th snap above) Final aim is to test with minimum 100M records. Let me know your inputs Regards, Vinay Patil |
Re: Checkpointing with RocksDB as statebackend
|
In reply to this post by Stephan Ewen
Hi Stephan, Just saw your mail while I was explaining the answer to your earlier questions. I have attached some more screenshots which are taken from the latest run today. Yes I will try to set it to higher value and check if performance improves Let me know your thoughts Regards, Vinay Patil On Tue, Feb 21, 2017 at 12:51 AM, Stephan Ewen [via Apache Flink User Mailing List archive.] <[hidden email]> wrote:
|
Re: Checkpointing with RocksDB as statebackend
|
Hi!
I cannot find the screenshots you attached. The Apache Mailing lists sometimes don't support attachments, can you link to the screenshots some way else? Stephan On Mon, Feb 20, 2017 at 8:36 PM, vinay patil <[hidden email]> wrote:
|
|
Stephan: The links were in the other email from vinay.
|
Re: Checkpointing with RocksDB as statebackend
|
In reply to this post by Stephan Ewen
Hi Stephan,
You can see the snaphots in the earlier mail When the size of the record increases task managers are getting killed with the default FLASH_SSD_OPTIMIZED option. When I tried to set backgroundflushes to 4 and backgroundCompactions to 8 it ran for more time but then I got the following exception : AsynchronousException{java.lang.Exception: Could not materialize checkpoint 39 for operator WindowOp at org.apache.flink.streaming.runtime.tasks.StreamTask$AsyncCheckpointRunnable.run(StreamTask.java:980) at java.util.concurrent.Executors$RunnableAdapter.call(Executors.java:511) at java.util.concurrent.FutureTask.run(FutureTask.java:266) at java.util.concurrent.ThreadPoolExecutor.runWorker(ThreadPoolExecutor.java:1142) at java.util.concurrent.ThreadPoolExecutor$Worker.run(ThreadPoolExecutor.java:617) at java.lang.Thread.run(Thread.java:745) Regards, Vinay Patil |
Re: Checkpointing with RocksDB as statebackend
|
Hey Vinay!
Do you have more of the stack trace? It seems like the root exception is missing... Stephan On Wed, Feb 22, 2017 at 9:55 AM, vinay patil <[hidden email]> wrote: Hi Stephan, |
Re: Checkpointing with RocksDB as statebackend
|
Hi Stephan,
Anyways the Async exception is gone. I have increased my instance type to r3.2xlarge having 60GB of memory. BUt what I have observed here is that for two task managers the memory usage is close to 30GB but for other two it goes up to 55GB, the load is equally distributed among all TM's. Why does this happen ? |
Re: Checkpointing with RocksDB as statebackend
|
Hi, When I disabled checkpointing the memory usage is similar for all nodes, this means that for checkpointing enabled case the data is first flushed to memory of CORE nodes (DataNode daemon is running here in case of EMR ) .Regards, Vinay Patil On Thu, Feb 23, 2017 at 7:50 PM, vinay patil [via Apache Flink User Mailing List archive.] <[hidden email]> wrote: Hi Stephan, |
|
The FSStatebackend uses the heap to keep the data, only the state snapshots are stored in the file system. On Thu, Feb 23, 2017 at 6:13 PM, vinay patil <[hidden email]> wrote:
|
Re: Checkpointing with RocksDB as statebackend
|
In reply to this post by Vinay Patil
Hi Vinay! If you see that the memory usage is different when you checkpoint, it can be two things: (1) RocksDB needs to hold onto some snapshot state internally while the async background snapshot happens. That requires some memory. (2) There is often data buffered during the alignment of checkpoints, which Flink write to locak file streams. That means that the disk cache takes more memory, when memory is left. Since you are writing to S3, there may be more implications. S3 sometimes throttles connections, meaning that some nodes get less upload bandwidth than others, and their snapshot takes longer. Those nodes have to hold onto the snapshot state for longer before they can release it. A few things I would try: - Try how it works if you make checkpoints less frequent, giving the application more time between checkpoints. Once you find a stable interval, let's tune it from there (make improvements that make the interval shorter) - Incremental checkpoints is going to help a lot with making the interval shorter again, we try to get those into Flink 1.3 - You can try to optimize the program a but, make processing per record faster. That helps to faster catch up if one of the nodes becomes a straggler during checkpoints. - Common options to tune is to see if you can enable object reuse (if your program is save) and to make sure the types you store in the state serialize efficiently. Concerning the FsStateBackend: - It stores all objects on the heap, hits no disk. It works well enough if you don't do to the limit of the JVM heap (JVM performs bad if it does not have a certain amount of spare help memory during GC). - It currently snapshots synchronously, which gives a throughput hit upon checkpoints. - We have a brand new variant that does this asynchronously and thus should behave much better. We will merge that beginning of next week. That one could be worth checking out for you, I will ping you once it is available. Maybe Stefan (in cc) has an early access branch that he can share. Hope that helps! Greetings, Stephan On Thu, Feb 23, 2017 at 6:13 PM, vinay patil <[hidden email]> wrote:
|
Re: Checkpointing with RocksDB as statebackend
|
Hi Stephan,
Thank you for the brief explanation. Yes I have already enabled Object Reuse mode because of which I see significant improvement. I am currently running on r3.4xlarge having 122GB memory, as you suggested I had increased the checkpoint interval to 10minutes and minimum pause between checkpoints was 5 minutes, here the complete processing was done in 8 minutes :) (before even a single checkpoint was triggered) That's why I decreased the checkpoint interval to 3 minutes, but observed that pipeline stops for a long amount of time for checkpoint, here the Kafka source was taking the maximum time to acknowledge and complete the checkpoints (4minutes timeout) , it failed for 3 consecutive time. Can't we make Kafka do asynchronous checkpoints ? because I see consistent failure of checkpoints for Kafka. I have not observed window checkpoints getting failed as they are done asynchronously. |
Re: Checkpointing with RocksDB as statebackend
|
Hi,
I have attached a snapshot for reference: As you can see all the 3 checkpointins failed , for checkpoint ID 2 and 3 it is stuck at the Kafka source after 50% (The data sent till now by Kafka source 1 is 65GB and sent by source 2 is 15GB ) Within 10minutes 15M records were processed, and for the next 16minutes the pipeline is stuck , I don't see any progress beyond 15M because of checkpoints getting failed consistently. 
|
Re: Checkpointing with RocksDB as statebackend
|
Hi Vinay!
True, the operator state (like Kafka) is currently not asynchronously checkpointed. While it is rather small state, we have seen before that on S3 it can cause trouble, because S3 frequently stalls uploads of even data amounts as low as kilobytes due to its throttling policies. That would be a super important fix to add! Best, Stephan On Fri, Feb 24, 2017 at 2:58 PM, vinay patil <[hidden email]> wrote: Hi, |
Re: Checkpointing with RocksDB as statebackend
|
Hi Stephan, So do you mean that S3 is causing the stall , as I have mentioned in my previous mail, I could not see any progress for 16minutes as checkpoints were getting failed continuously. On Feb 24, 2017 8:30 PM, "Stephan Ewen [via Apache Flink User Mailing List archive.]" <[hidden email]> wrote:
|
Re: Checkpointing with RocksDB as statebackend
|
Flink's state backends currently do a good number of "make sure this exists" operations on the file systems. Through Hadoop's S3 filesystem, that translates to S3 bucket list operations, where there is a limit in how many operation may happen per time interval. After that, S3 blocks.
It seems that operations that are totally cheap on HDFS are hellishly expensive (and limited) on S3. It may be that you are affected by that. We are gradually trying to improve the behavior there and be more S3 aware. Both 1.3-SNAPSHOT and 1.2-SNAPSHOT already contain improvements there. Best, Stephan On Fri, Feb 24, 2017 at 4:42 PM, vinay patil <[hidden email]> wrote:
|
Re: Checkpointing with RocksDB as statebackend
|
Hi Stephan, To verify if S3 is making teh pipeline stall, I have replaced the S3 sink with HDFS and kept minimum pause between checkpoints to 5minutes, still I see the same issue with checkpoints getting failed.Regards, Vinay Patil On Fri, Feb 24, 2017 at 10:09 PM, Stephan Ewen [via Apache Flink User Mailing List archive.] <[hidden email]> wrote:
|
Re: Checkpointing with RocksDB as statebackend
|
In reply to this post by Stephan Ewen
HI Stephan, Just to avoid the confusion here, I am using S3 sink for writing the data, and using HDFS for storing checkpoints.I replaced s3 sink with HDFS for writing data in my last test. Let's say the checkpoint interval is 5 minutes, now within 5minutes of run the state size grows to 30GB , after checkpointing the 30GB state that is maintained in rocksDB has to be copied to HDFS, right ? is this causing the pipeline to stall ? Regards, Vinay Patil On Sat, Feb 25, 2017 at 12:22 AM, Vinay Patil <[hidden email]> wrote:
|
| Free forum by Nabble | Edit this page |

