user defined metrics showed in Flink UI but not datadog
|
Hi,
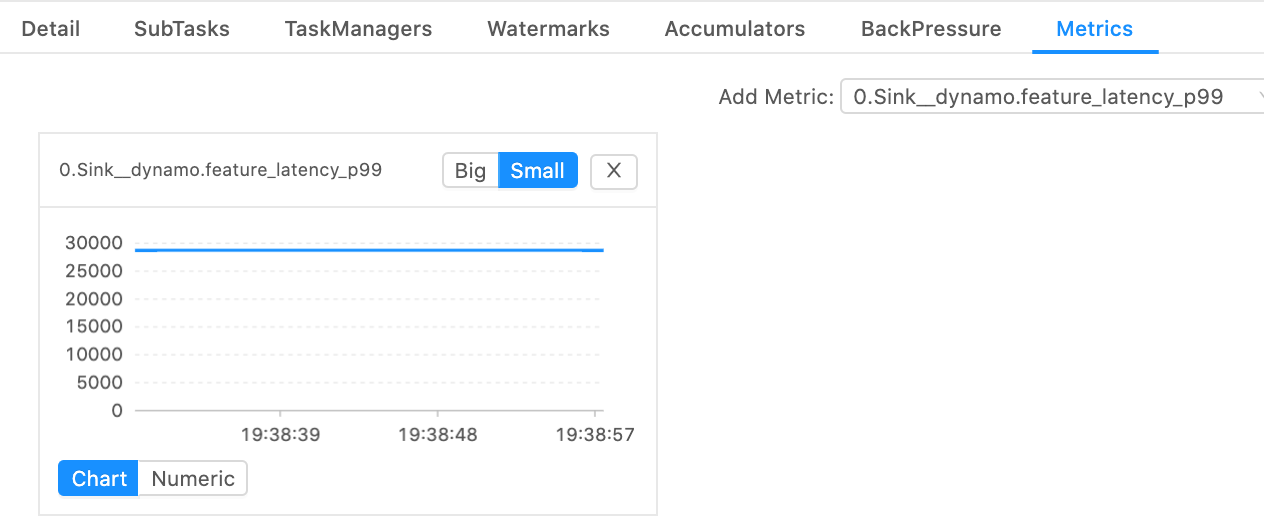
I followed [1] to define my own metric as: val dropwizardHistogram = new com.codahale.metrics.Histogram(new SlidingWindowReservoir(500)) histogram = getRuntimeContext .getMetricGroup .histogram("feature_latency", new DropwizardHistogramWrapper(dropwizardHistogram)) and it is successfully shown up in the flink UI:  however, I couldn't find it in datadog. my flink conf looks like: "metrics.reporter.dghttp.factory.class" -> "org.apache.flink.metrics.datadog.DatadogHttpReporterFactory", "metrics.scope.operator" -> "flink.op", "metrics.scope.jm.job" -> "flink.jm.job", "metrics.scope.jm" -> "flink.jm", "metrics.scope.tm" -> "flink.tm", "metrics.scope.tm.job" -> "flink.tm.job", "metrics.scope.task" -> "flink.task", Am I missing something that is necessary for datadog to report my customized metrics? Thanks, Fanbin |
Re: user defined metrics showed in Flink UI but not datadog
|
It appears that the datadog reporter
does not report histograms. I'll file an issue to fix that.
On 12/8/2020 4:42 AM, Fanbin Bu wrote:
|
|
thank you Chesnay. I did verified that count works with datadog. Please link here the ticket once you create it. Meanwhile, is there any workaround for now? Fanbin On Tue, Dec 8, 2020 at 2:56 AM Chesnay Schepler <[hidden email]> wrote:
|
Re: user defined metrics showed in Flink UI but not datadog
|
There is no workaround in the current
Flink releases, but you could compile the reporter based on the PR
that I opened.
On 12/8/2020 10:38 PM, Fanbin Bu wrote:
|
«
Return to (DEPRECATED) Apache Flink User Mailing List archive.
|
1 view|%1 views
| Free forum by Nabble | Edit this page |


