Re: How can I prove ....
Posted by amir bahmanyari on
URL: http://deprecated-apache-flink-user-mailing-list-archive.369.s1.nabble.com/How-can-I-prove-tp9113p9186.html

From: Stephan Ewen <[hidden email]>
To: [hidden email]; amir bahmanyari <[hidden email]>
Cc: Felix Dreissig <[hidden email]>
Sent: Monday, September 26, 2016 2:18 AM
Subject: Re: How can I prove ....
URL: http://deprecated-apache-flink-user-mailing-list-archive.369.s1.nabble.com/How-can-I-prove-tp9113p9186.html
Thanks Stephan.
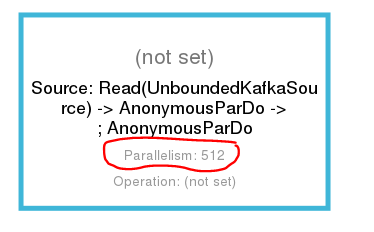
I dont see a "graph" in JM's "Dashboard" when I click on the running job...I see a box like below with Parallelism = 512 which is what I have set as the parallelism degree in my code:
options.setParallelism(512);
Does this mean the cluster is now fully running on its max capacity?
Interesting enough, there is no change in Send/Received columns of the Running slots in the servers below: all zeros all the time...
But, its says "Running" as per each server's configured slots which totals to 512. Just no dynamic data being presented here although the data is actually being processed for sure.
Shouldnt they dynamically change as data is being processed?
Thanks+regards
Amir-
From: Stephan Ewen <[hidden email]>
To: [hidden email]; amir bahmanyari <[hidden email]>
Cc: Felix Dreissig <[hidden email]>
Sent: Monday, September 26, 2016 2:18 AM
Subject: Re: How can I prove ....
You do not need to create any JSON.
Just click on "Running Jobs" in the UI, and then on the job. The parallelism is shown as a number in the boxes of the graph.
On Sat, Sep 24, 2016 at 6:28 PM, amir bahmanyari <[hidden email]> wrote:
Thanks Felix.Interesting. I tried to create the JASON but didnt work according to the sample code I found in docs.There is a way to get the same JASON from the command line.Is there an example?Thanks+regardsAmir-
From: Felix Dreissig <[hidden email]>
To: amir bahmanyari <[hidden email]>
Cc: [hidden email]
Sent: Saturday, September 24, 2016 8:18 AM
Subject: Re: How can I prove ....
Hi Amir,
On 23 Sep 2016, at 19:57, amir bahmanyari <[hidden email]> wrote:
> Currently running with 512 slots all taken as indicated by the dashboard.
> Are we talking about this? Then yes based on no available slots, I assume I am at 512 .
I guess Stephan is referring to the parallelism of single operators as displayed in the operator graph, see e.g. https://ci.apache.org/ projects/flink/flink-docs- release-0.10/page/img/ webclient_plan_view.png .
Regards,
Felix
| Free forum by Nabble | Edit this page |