Re: Imbalanced workload between workers
Posted by Pieter Hameete on
URL: http://deprecated-apache-flink-user-mailing-list-archive.369.s1.nabble.com/Imbalanced-workload-between-workers-tp4511p4547.html
URL: http://deprecated-apache-flink-user-mailing-list-archive.369.s1.nabble.com/Imbalanced-workload-between-workers-tp4511p4547.html
Hi Till and Stephan,
I've got some additional information. I just ran a query 60 times in a row, and all jobs ran in roughly the same time. I did this for both a simple job that requires intensive parsing and a more complex query that has several cogroups. Neither of the cases showed any slowing down. I believe this is an indication that it is not a problem with unreliable I/O or computational resources.
However, when I now run the complete set of 15 different queries again, with 3 repetitions each, things start slowing down very quickly.
The code I use to run the jobs can be found here: https://github.com/PHameete/dawn-flink/blob/feature/loading-algorithm-v2/src/main/scala/wis/dawnflink/performance/DawnBenchmarkSuite.scala
I run this as follows in the GCloud: /flink run dawn-flink.jar gs://dawn-flink/data/split4G gs://dawn-flink/output/ 3 result.csv
Is there something I am doing incorrectly by running these different queries in sequence like this? I have attempted parametrizing further so I would call ./flink run for each separate query but this did not make a difference.
Cheers!
- Pieter
2016-01-28 11:28 GMT+01:00 Pieter Hameete <[hidden email]>:
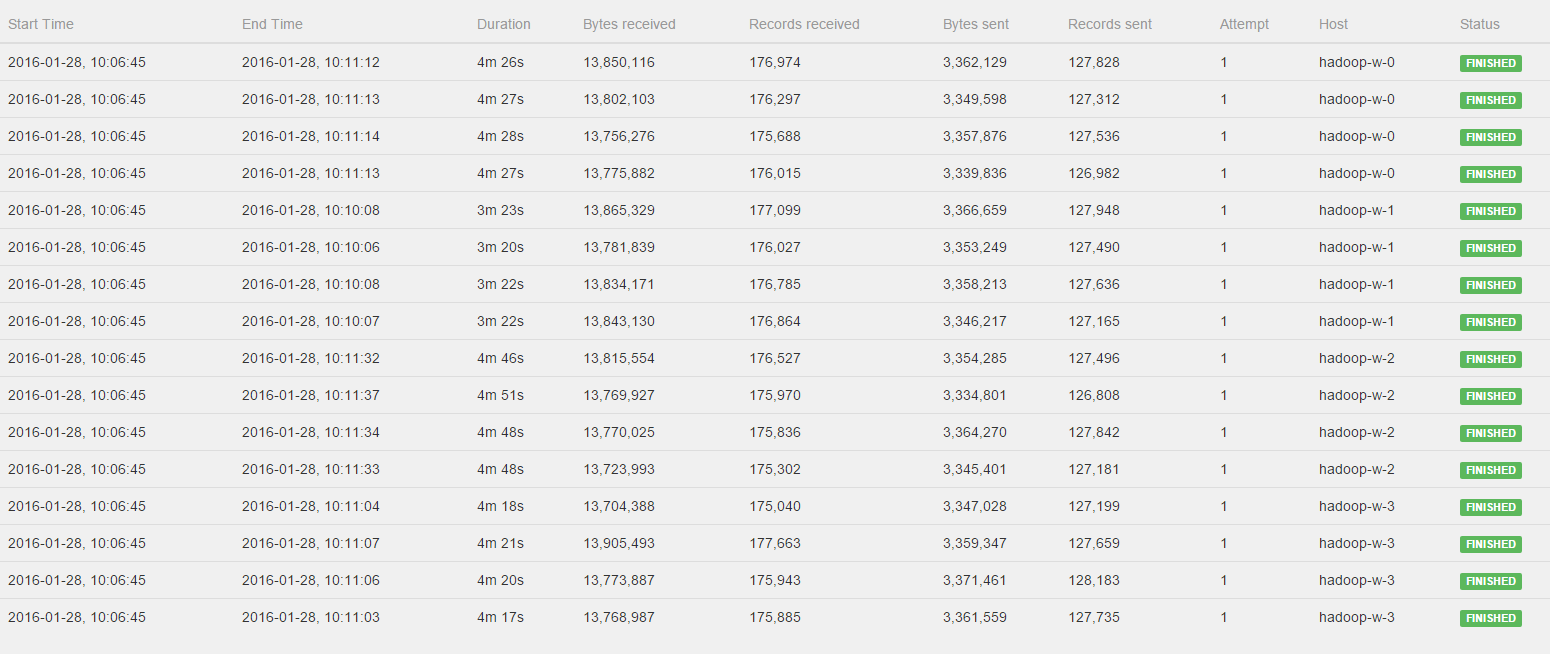
Hi Till, Stephan,Indeed I think you're right it is just a coincidence that the three jobs started producing output as soon as the first one finished. Getting back to my comment that after the upgrade to Flink 0.10.1 the job was much faster I searched a bit further. I've now noticed that after setting up a fresh GCloud cluster the job runs roughly 15x faster than the case I just showed you. Im executing many, many jobs in sequence and it seems as if performance is degrading a lot over time. Let me tell you what I'm doing exactly:I'm running a set of 16 queries in sequence on the cluster. Each query is executed multiple (5) times in a row so I can average measurements for a more reliable estimate of performance in the GCloud. This means that I'm running a total of 60 jobs in sequence, and on 5 different datasets, totalling to 300 jobs. For each job I get the execution environment, define the query, write to an output file and run the env.execute. After each job I clear the output folder so the next job can start fresh.Now I'm wondering what causes this performance degradation. Could this have to do with the GCloud (I surely hope they don't scale back my performance by 90% ;-) , do I need to some more cleaning and resetting on the Flink Cluster, or is my above approach asking for trouble?Thanks again for your help!- Pieter2016-01-28 10:58 GMT+01:00 Till Rohrmann <[hidden email]>:Hi Pieter,you can see in the log that the operators are all started at the same time. However, you're right that they don't finish at the same time. The sub tasks which run on the same node exhibit a similar runtime. However, all nodes (not only hadoop-w-0 compared to the others) show different runtimes. I would guess that this is due to some other load on the GCloud machines or some other kind of asymmetry between the hosts.Cheers,TillOn Thu, Jan 28, 2016 at 10:17 AM, Pieter Hameete <[hidden email]> wrote:Hi Stephen, Till,I've watched the Job again and please see the log of the CoGroup operator:All workers get to process a fairly distributed amount of bytes and records, BUT hadoop-w-0, hadoop-w-2 and hadoop-w-3 don't start working until hadoop-w-1 is finished. Is this behavior to be expected with a CoGroup or could there still be something wrong in the distrubtion of the data?Kind regards,Pieter2016-01-27 21:48 GMT+01:00 Stephan Ewen <[hidden email]>:Hi Pieter!Interesting, but good :-)I don't think we did much on the hash functions since 0.9.1. I am a bit surprised that it made such a difference. Well, as long as it improves with the newer version :-)Greetings,StephanOn Wed, Jan 27, 2016 at 9:42 PM, Pieter Hameete <[hidden email]> wrote:Hi Till,i've upgraded to Flink 0.10.1 and ran the job again without any changes to the code to see the bytes input and output of the operators and for the different workers.To my surprise it is very well balanced between all workers and because of this the job completed much faster.Are there any changes/fixes between Flink 0.9.1 and 0.10.1 that could cause this to be better for me now?Thanks,Pieter2016-01-27 14:10 GMT+01:00 Pieter Hameete <[hidden email]>:Cheers for the quick reply Till.That would be very useful information to have! I'll upgrade my project to Flink 0.10.1 tongiht and let you know if I can find out if theres a skew in the data :-)- Pieter2016-01-27 13:49 GMT+01:00 Till Rohrmann <[hidden email]>:Could it be that your data is skewed? This could lead to different loads on different task managers.With the latest Flink version, the web interface should show you how many bytes each operator has written and received. There you could see if one operator receives more elements than the others.Cheers,TillOn Wed, Jan 27, 2016 at 1:35 PM, Pieter Hameete <[hidden email]> wrote:Hi guys,Currently I am running a job in the GCloud in a configuration with 4 task managers that each have 4 CPUs (for a total parallelism of 16).However, I noticed my job is running much slower than expected and after some more investigation I found that one of the workers is doing a majority of the work (its CPU load was at 100% while the others were almost idle).My job execution plan can be found here: http://i.imgur.com/fHKhVFf.pngThe input is split into multiple files so loading the data is properly distributed over the workers.I am wondering if you can provide me with some tips on how to figure out what is going wrong here:
- Could this imbalance in workload be the result of an imbalance in the hash paritioning?
- Is there a convenient way to see how many elements each worker gets to process? Would it work to write the output of the CoGroup to disk because each worker writes to its own output file and investigate the differences?
- Is there something strange about the execution plan that could cause this?
Thanks and kind regards,Pieter
| Free forum by Nabble | Edit this page |