Re: Wired pattern of syncing Kafka to Elasticsearch
Posted by Nicolaus Weidner on
URL: http://deprecated-apache-flink-user-mailing-list-archive.369.s1.nabble.com/Wired-pattern-of-syncing-Kafka-to-Elasticsearch-tp44242p44255.html
URL: http://deprecated-apache-flink-user-mailing-list-archive.369.s1.nabble.com/Wired-pattern-of-syncing-Kafka-to-Elasticsearch-tp44242p44255.html
Hi Kai,
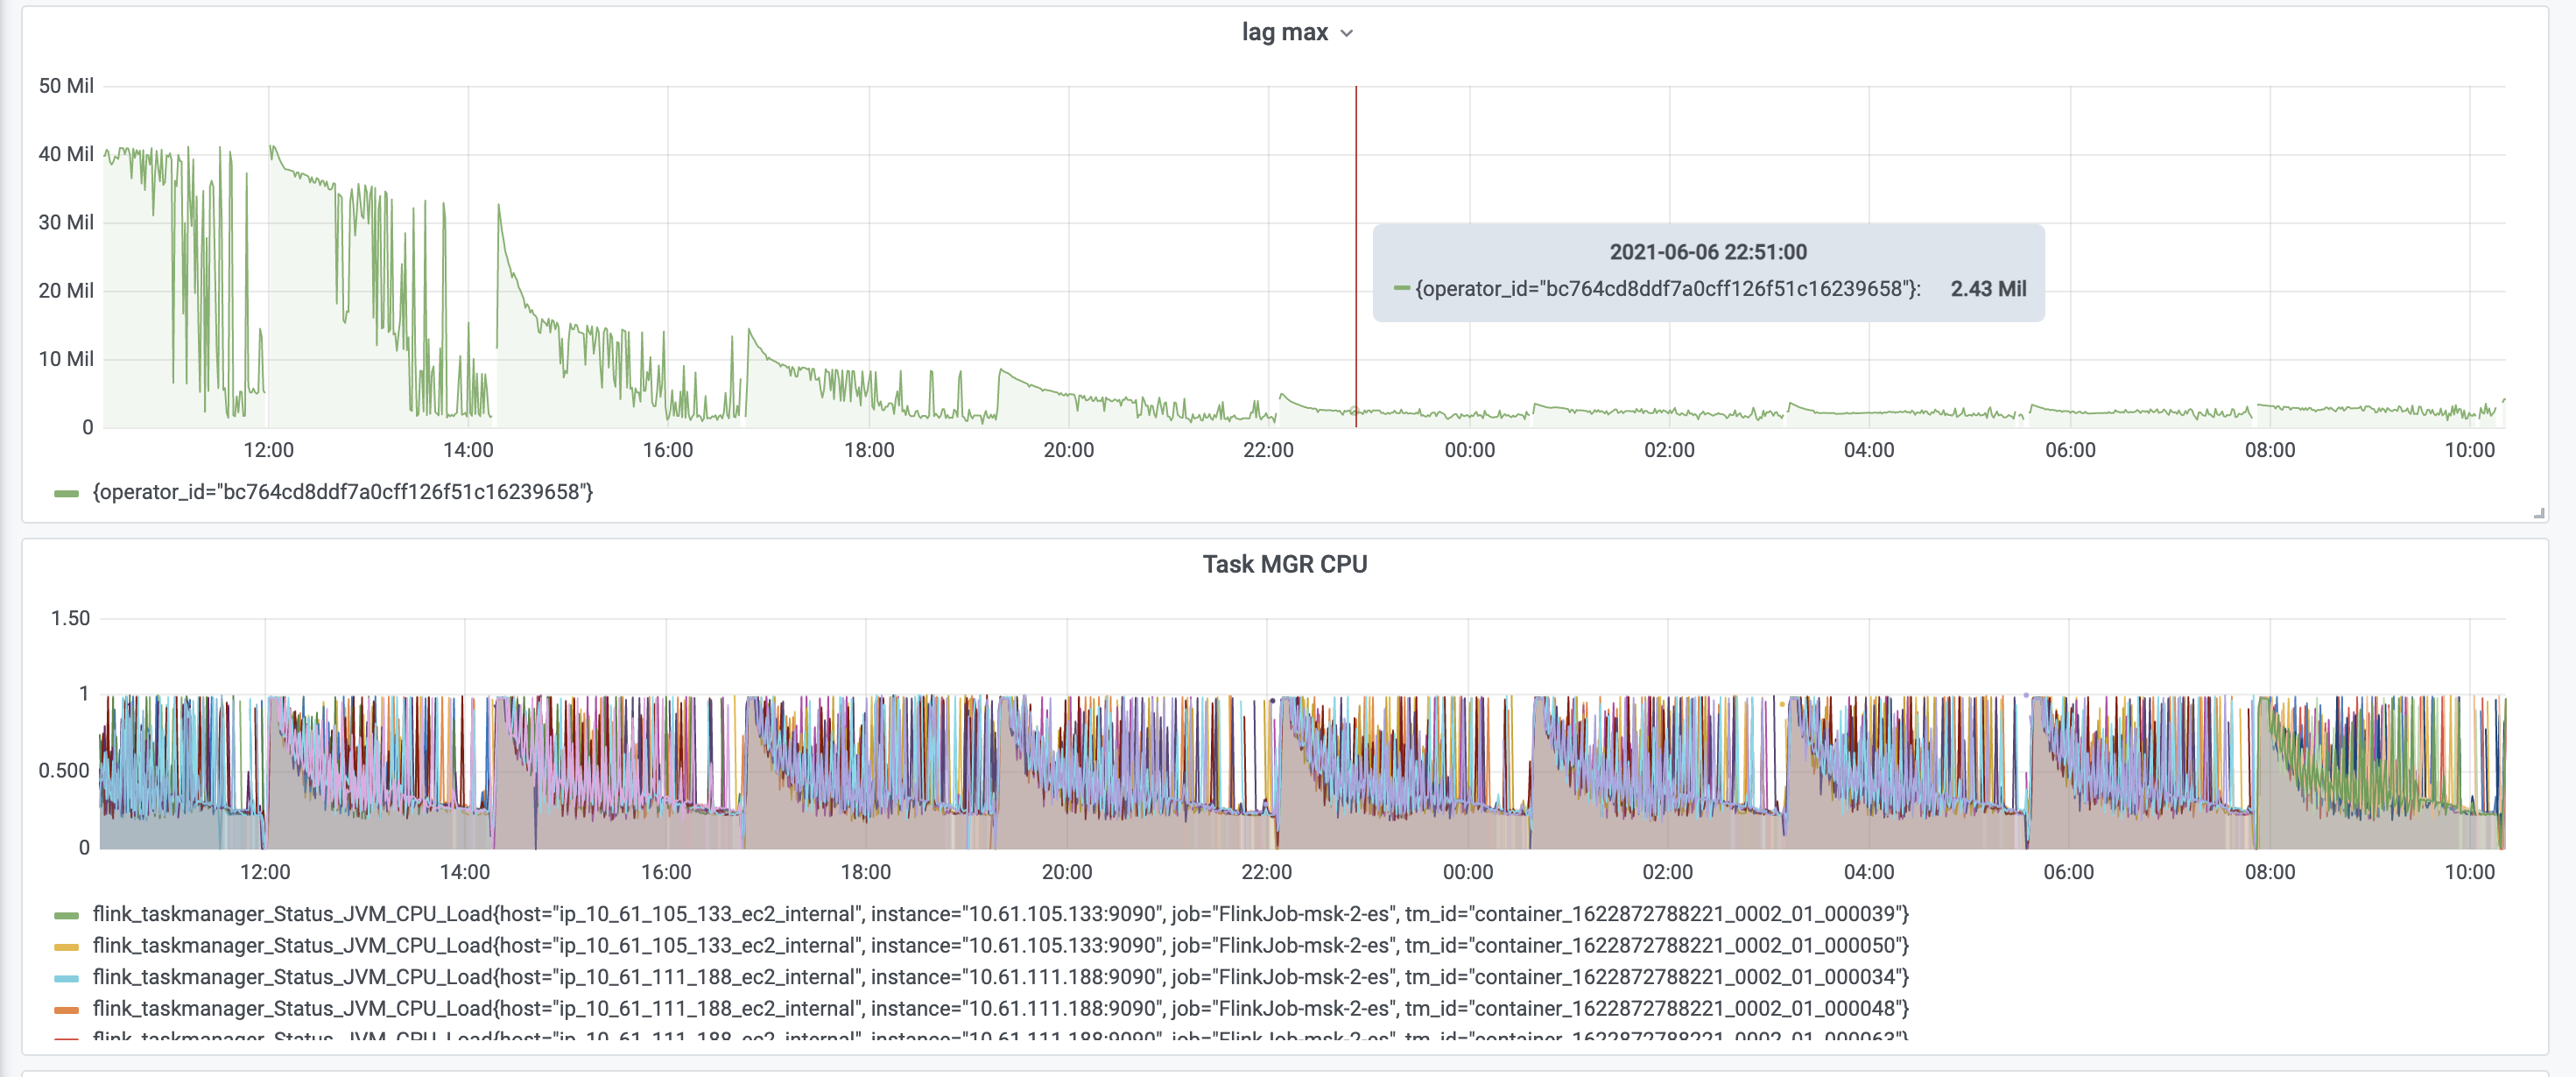
Do you have jobmanager and taskmanager logs to look at? Interesting moments could be when the job dies and restarts, but also when things start to become very jittery. In the lag max and task manager CPU graphs, it looks like this happens significantly before the job dies. It also looks like the job restored from that point, so probably no later checkpoint succeeded? I assume the frequent spikes in lag are not due to actual new events, but some issue with the job.
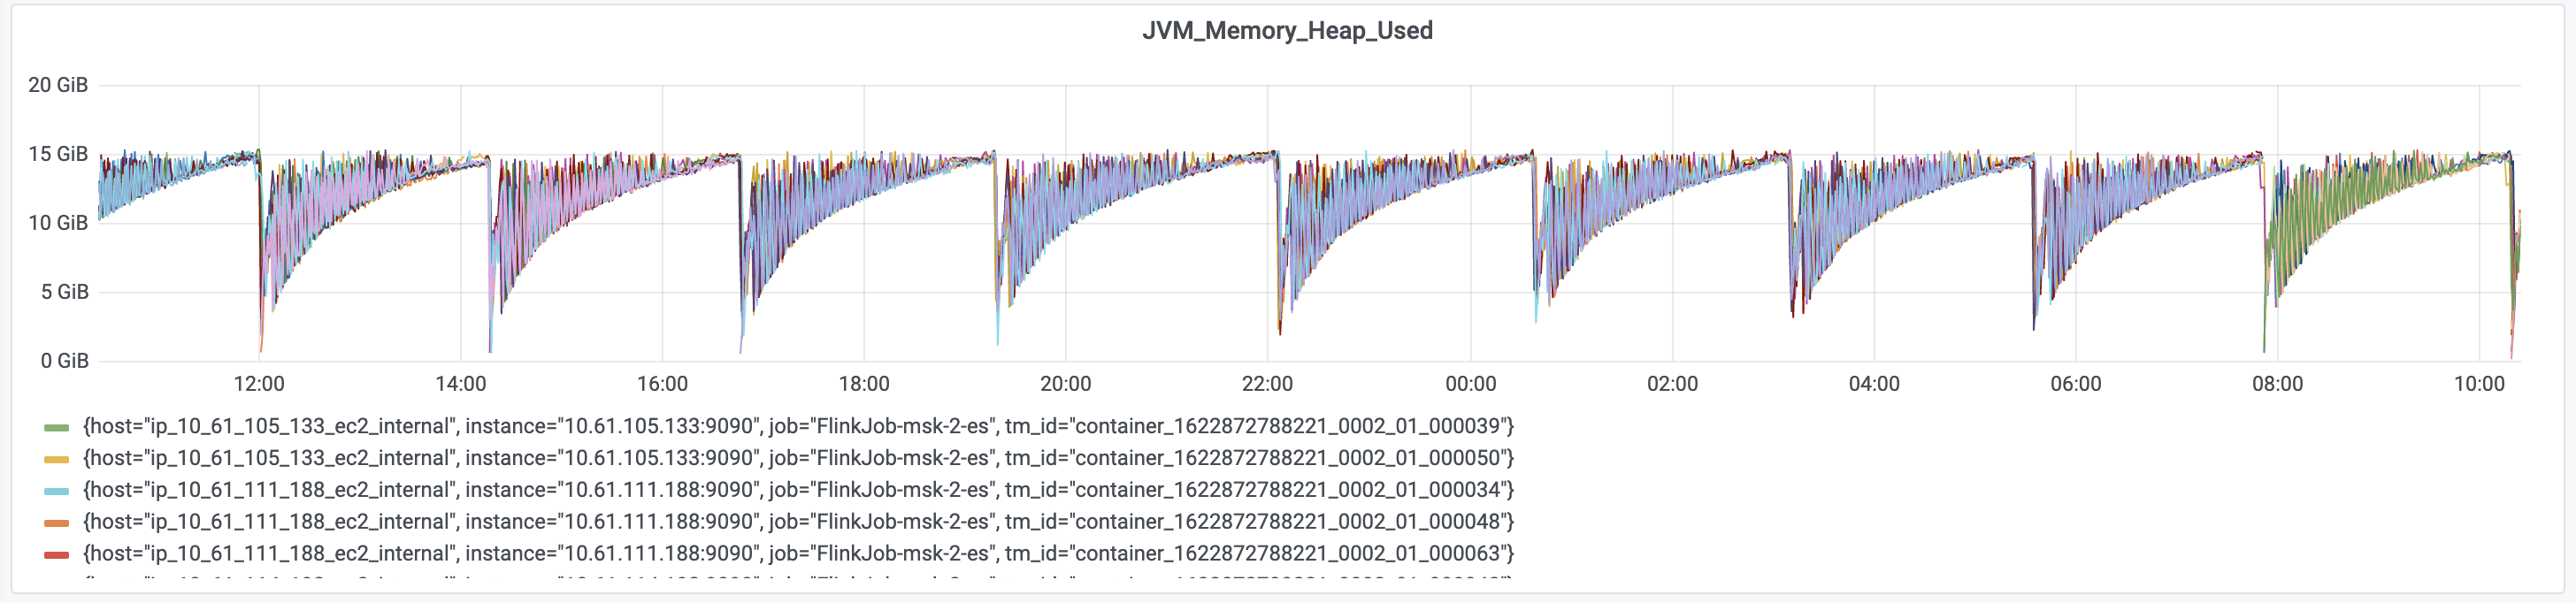
I assume JVM max heap is around 15GB? Which is the quarter of physical memory mentioned here [1]. It does look like JVM heap is slowly filling up and the job shows weird behavior once used memory crosses ~10GB. Does the job simply persist event data in Elasticsearch or perform other operations before?
Best wishes,
Nico
On Mon, Jun 7, 2021 at 5:01 AM Kai Fu <[hidden email]> wrote:
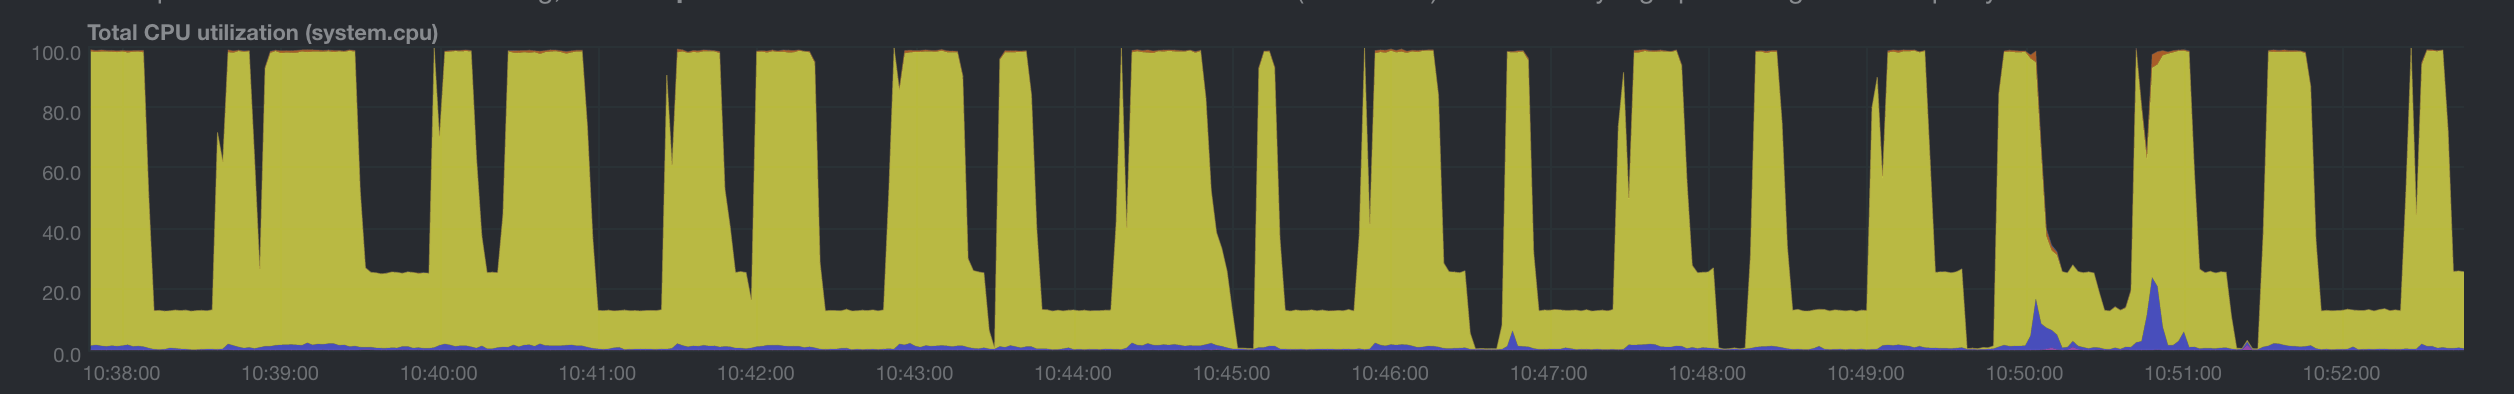
Hi team,We are using Flink to sync data from Kafka to Elasitcsearch and the Kafka is in upsert-mode. We detect some wired patterns as shown in the figure below.1. Job restarts regularly from the checkpoint for some unknown reasons;2. For each run, performance and CPU utilization degenerates as time goes on, and restarts till some point;3. The ES is far from being loaded and the job has the similar behavior even with blackhole sink;We doubt it's due to some unreasonable configuration of the memory, and we do notice some OutOfMemory exceptions in the log. Our host has 61GB memory and the memory configuration is as below:"taskmanager.memory.network.fraction": "0.2","taskmanager.memory.network.max": "8g","taskmanager.memory.network.min": "3g","taskmanager.memory.process.size": "40g"We've another job with a more fierce stream join workload with the same host type and memory configuration, and we do not face such issues. We even also tried enlarging the host type, the issue still exists. We doubt if the memory configuration is reasonable or if there is some memory leak somewhere. Is there any guidance on this?--Best wishes,- Kai
| Free forum by Nabble | Edit this page |