Re: Subtask skew of multiple left JOINs
Posted by JING ZHANG on
URL: http://deprecated-apache-flink-user-mailing-list-archive.369.s1.nabble.com/Subtask-skew-of-multiple-left-JOINs-tp44120p44123.html
URL: http://deprecated-apache-flink-user-mailing-list-archive.369.s1.nabble.com/Subtask-skew-of-multiple-left-JOINs-tp44120p44123.html
Hi Kai,
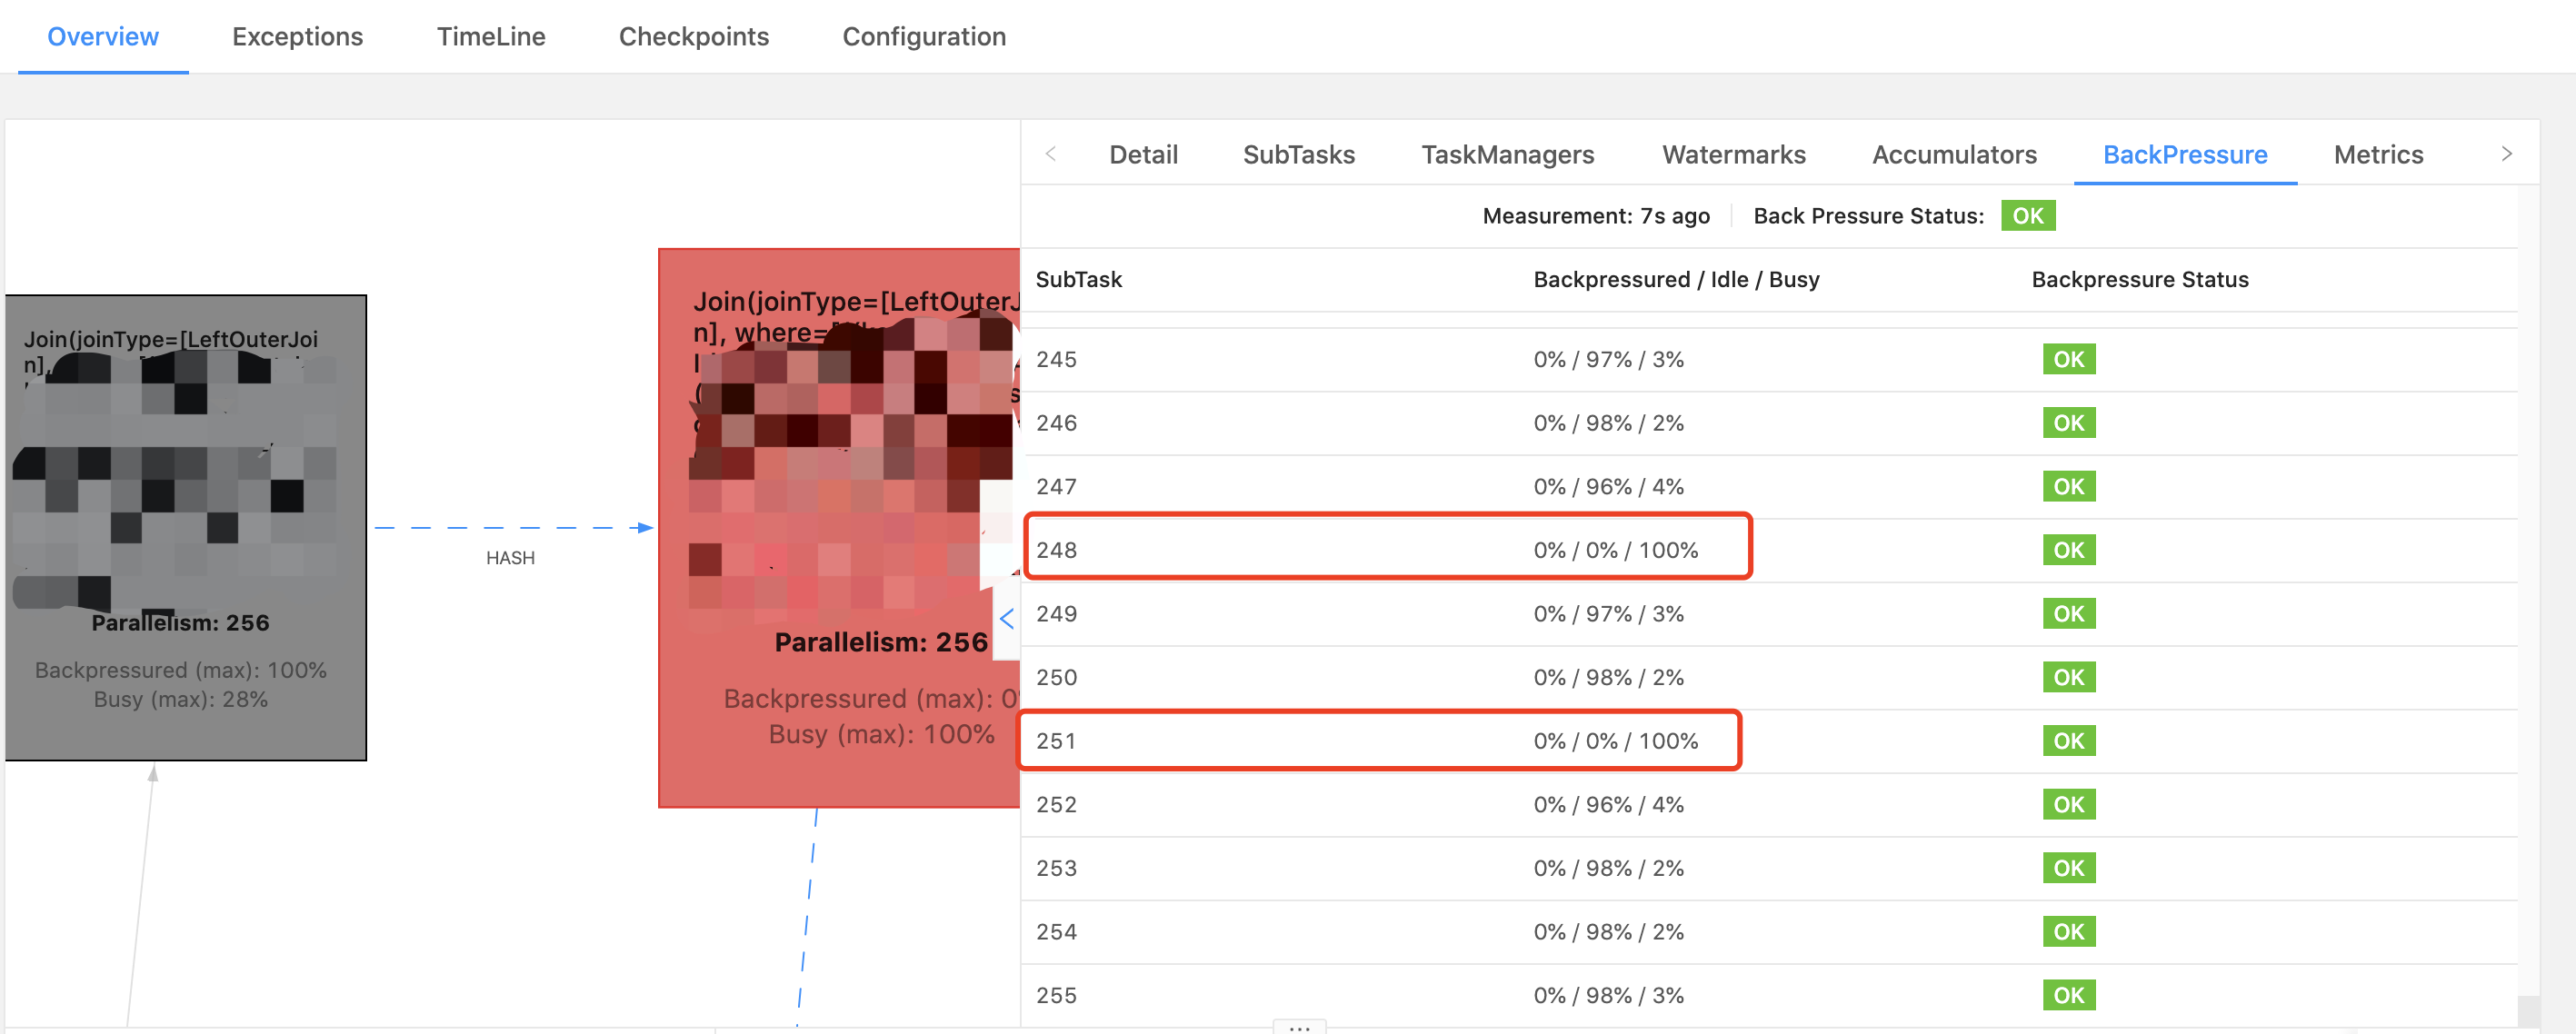
> 1. Does the one busy subtask cause back pressure for all subtasks upstream, or only some of them?
In fact one busy subtask could only cause backpressure for those upstream subtasks who need send data to the busy subtask. In your case, those upstream subtasks would be in back pressure who need hash shuffle data to subtask 248 and 251. You could double check by clicking the adjacent upstream operator's back pressure tabs.> If it only causes the back pressure of one/some of them, why can't others make progress?
In fact, those subtasks of adjacent upstream node who do need send data to hot busy downstream subtask could continue working. However, backpressure is propagated in the whole job pipeline until the most upstream source. Besides, things would be worse in your case because there are exists multiple hash join.
> Is there any hint on locating the bottleneck and overall optimization for this Job?
There is a very useful debug tool in 1.13.0, which could help your find out why subtask 248 and 251 is so busy. CPU FlameGraphs is supported in supported WebUI since 1.13.0, see[1][2].
Best regards,
JING ZHANG
Kai Fu <[hidden email]> 于2021年6月2日周三 上午8:19写道:
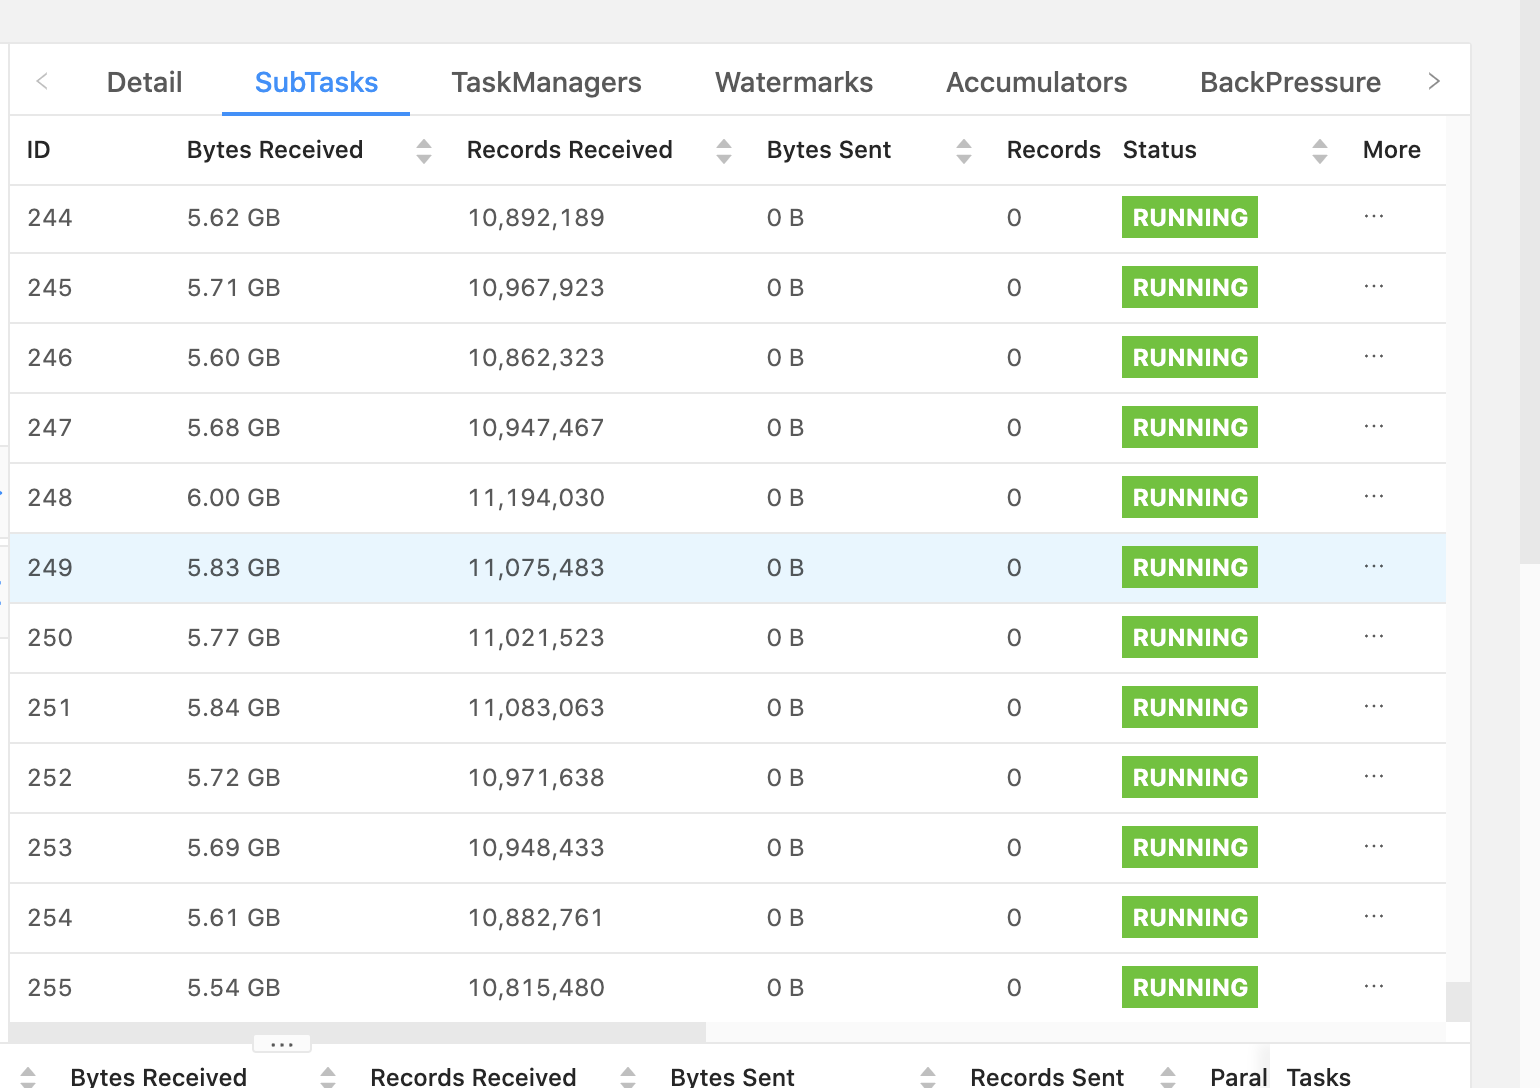
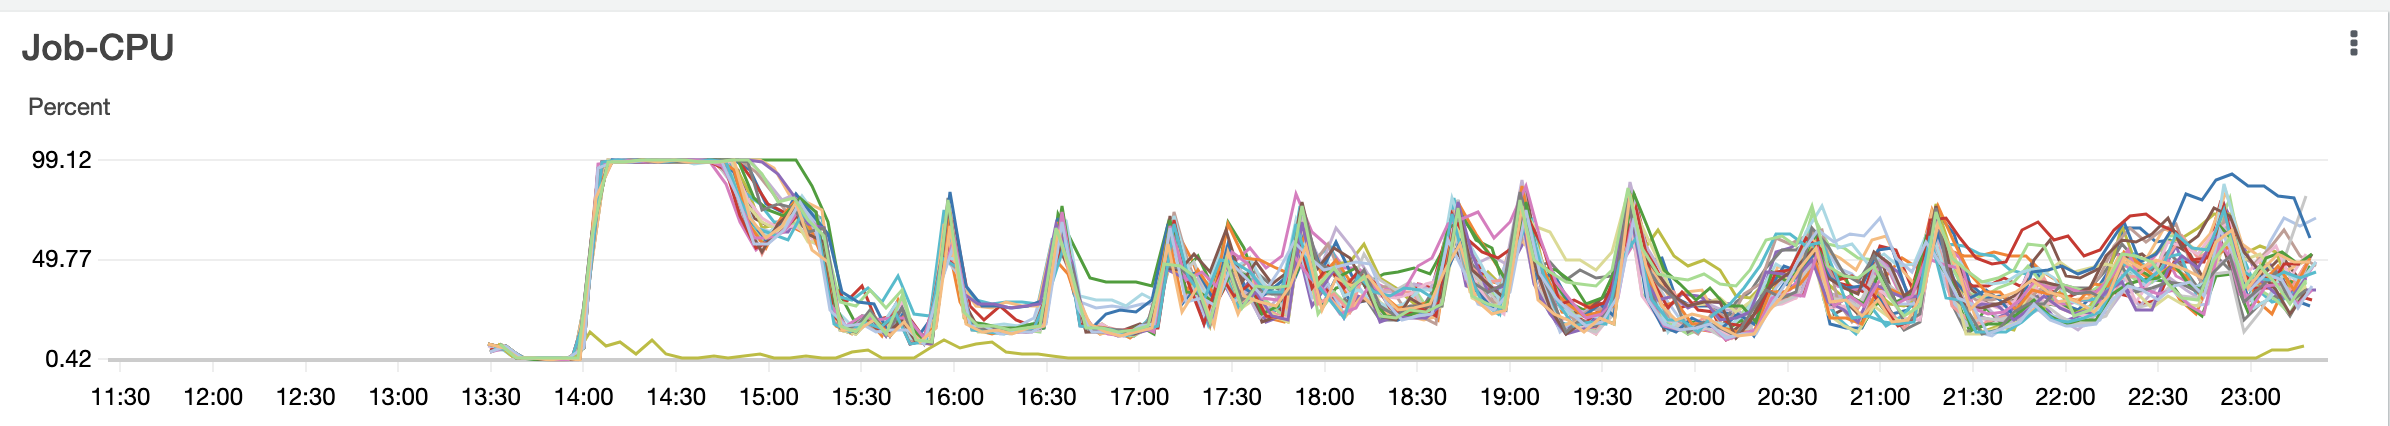
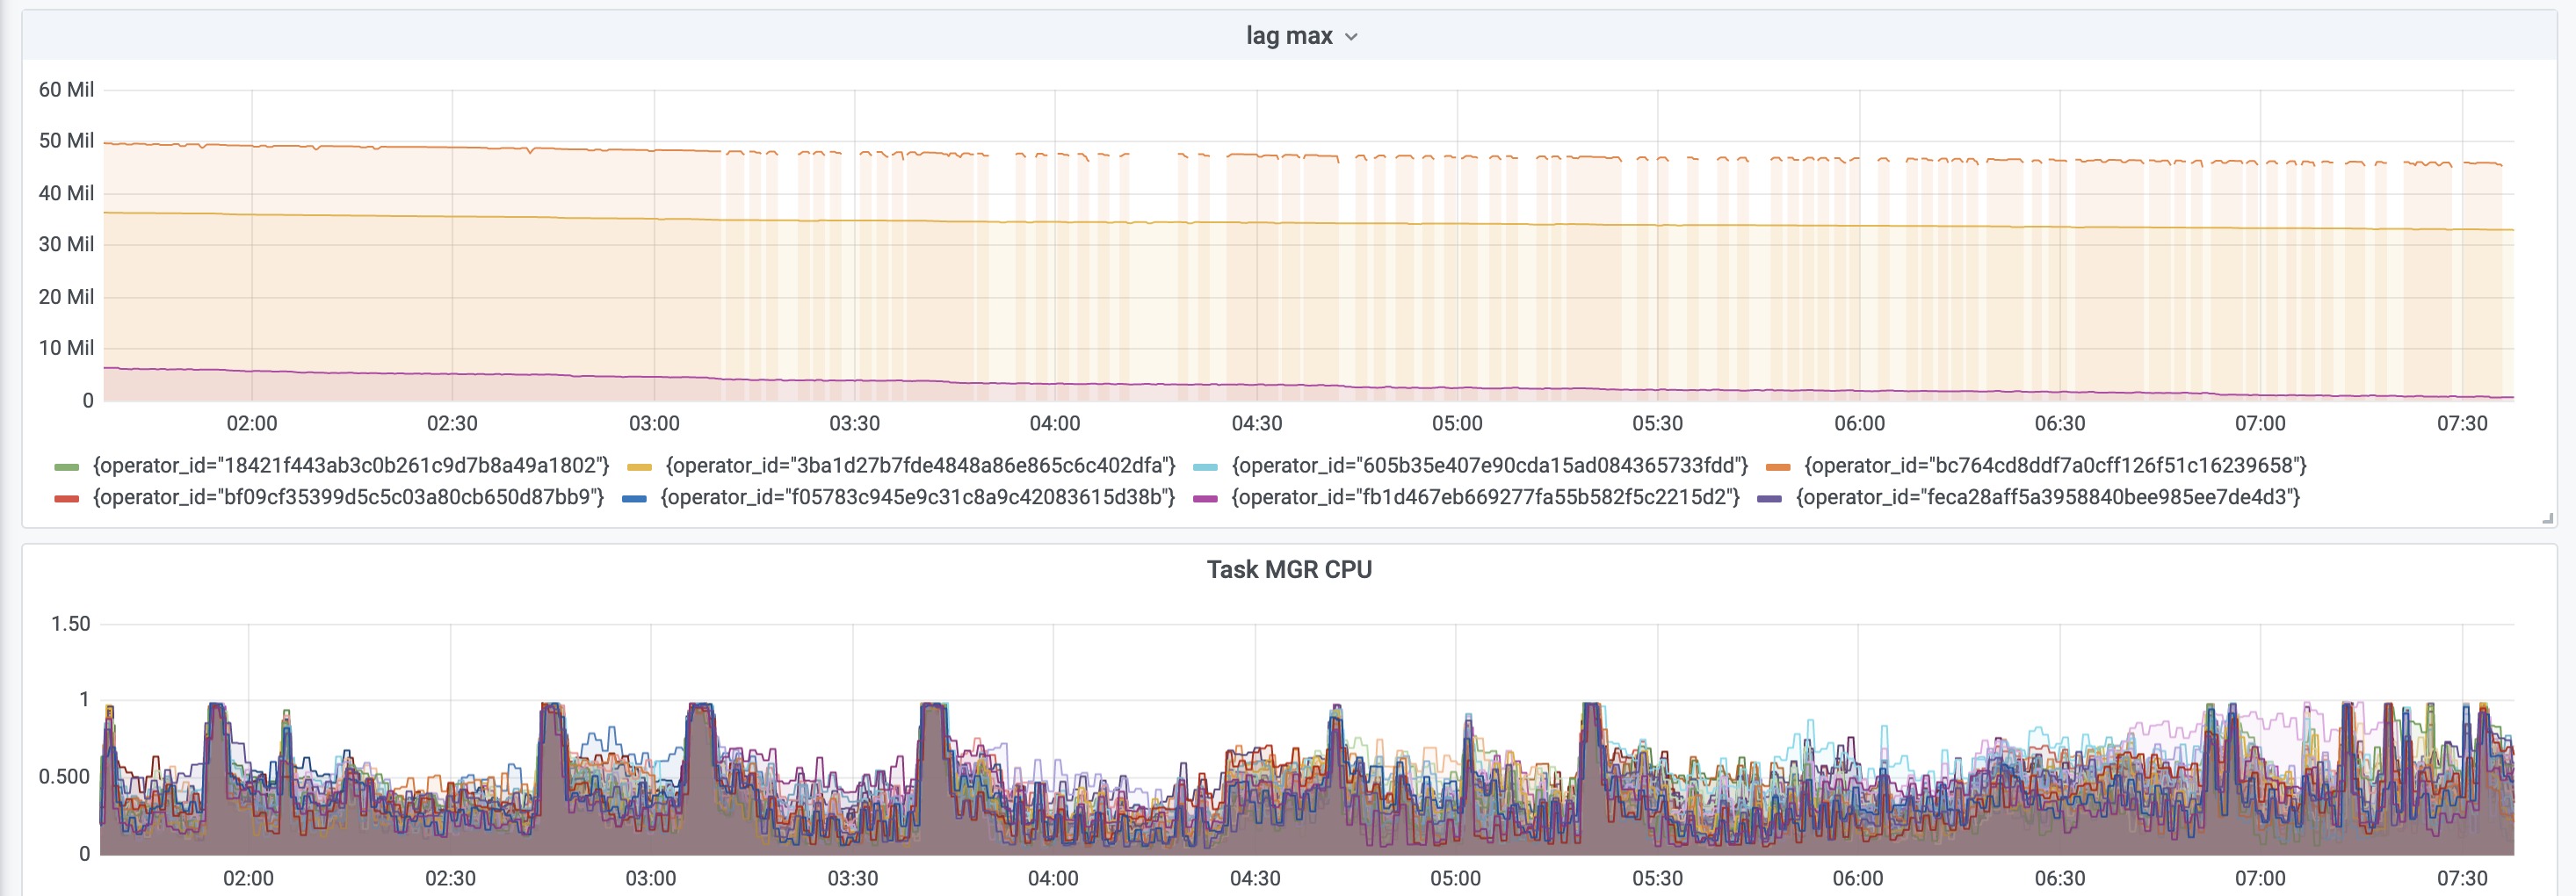
Hi team,We faced an issue that resource utilization of the subtask is skewed, while there is no data skew for our input data.We have 8 data sources joined together with left join. The left table contains 1.6B records, one of the right tables is about 1B, with others about 0.1B. The join is in SQL and it produces query plan of leftInputSec with HasUniqKey and rightInputSpec with JoinKeyContainsUniqueKey all the way down. There is not too much difference of the cardinality for all the join keys. By statistics, the top 100 cardinality skew is [1:65K, 1:17K], which is insignificant among 1.6B records.JOIN is CPU intensive and the CPU is saturated at the beginning of 1h and then it drops down to ~50%, while data in the Kafka sources are far from being consumed up. The Disk/Network utilization also drops down during that time. Considering JOIN is computational intensive, it should utilize as many resources as it can, while it seems not in our case and there are a lot of redundant resources without any apparent bottleneck.Our backend is rocksdb with checkpoint disable by enlarging the checkpoint interval to be INF. Host is 32 x i3.2xlarge from AWS, each with 8 CPU, 61GB memory, 1.7TB nvme SSD.The following are some related metrics. My questions are as follows:1. Does the one busy subtask cause back pressure for all subtasks upstream, or only some of them?2. If it only causes the back pressure of one/some of them, why can't others make progress?1. Is there any hint on locating the bottleneck and overall optimization for this Job?Figure-1. Subtask resource utilization skewFigure-2. No data skew for incoming recordsFigure-3. CPU utilization pattern of task managerFigure-4. Kafka source lag max and task MGR CPU utilization--Best wishes,- Kai
| Free forum by Nabble | Edit this page |