Re: Odd disk going up and down behavior
Posted by Chesnay Schepler on
URL: http://deprecated-apache-flink-user-mailing-list-archive.369.s1.nabble.com/Odd-disk-going-up-and-down-behavior-tp40519p40555.html
URL: http://deprecated-apache-flink-user-mailing-list-archive.369.s1.nabble.com/Odd-disk-going-up-and-down-behavior-tp40519p40555.html
That could be an explanation (but plain
checkpointing would also explain it I suppose), and it could also
explain the memory increasing if there is some some memory leak.
Have you checked whether job failures
line up with the graph?
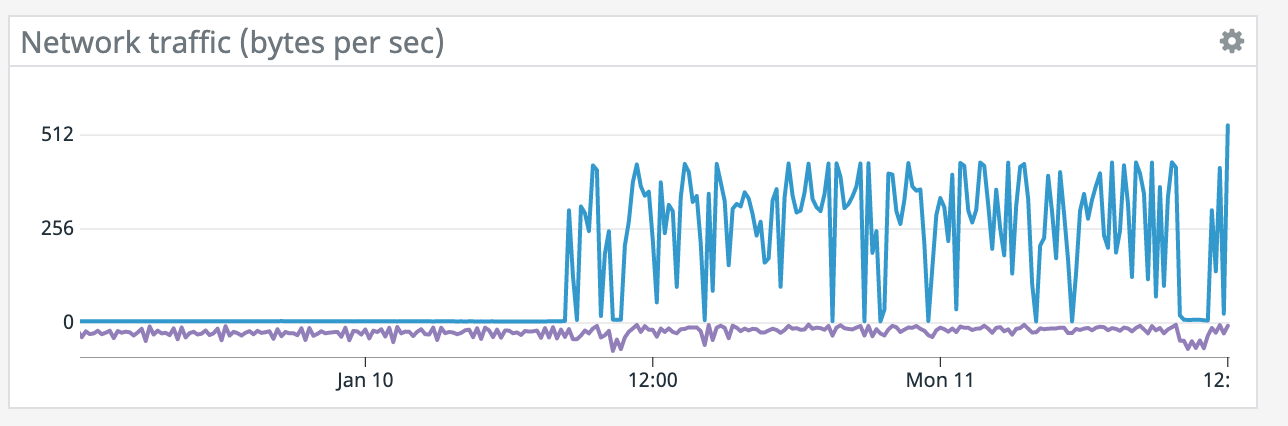
(what are the blue/purple lines in the
network graph respectively?)
On 1/12/2021 3:11 AM, Rex Fenley wrote:
We're seeing some intermittent Elasticsearch sink errors
Caused by: java.net.SocketTimeoutException: 30,000 milliseconds timeout on connection http-outgoing-10 [ACTIVE]but they don't seem to line up with the graph in most cases. I'm guessing it retries some number of times and maybe is then failing, and the disk dropping and going back up is from a restart.
Does this seem plausible?
On Mon, Jan 11, 2021 at 2:57 PM Rex Fenley <[hidden email]> wrote:
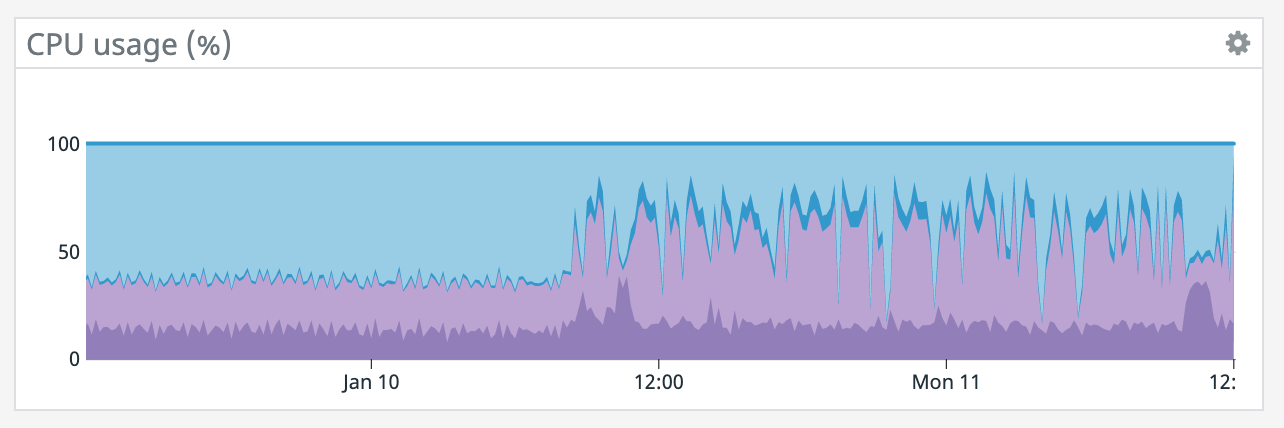
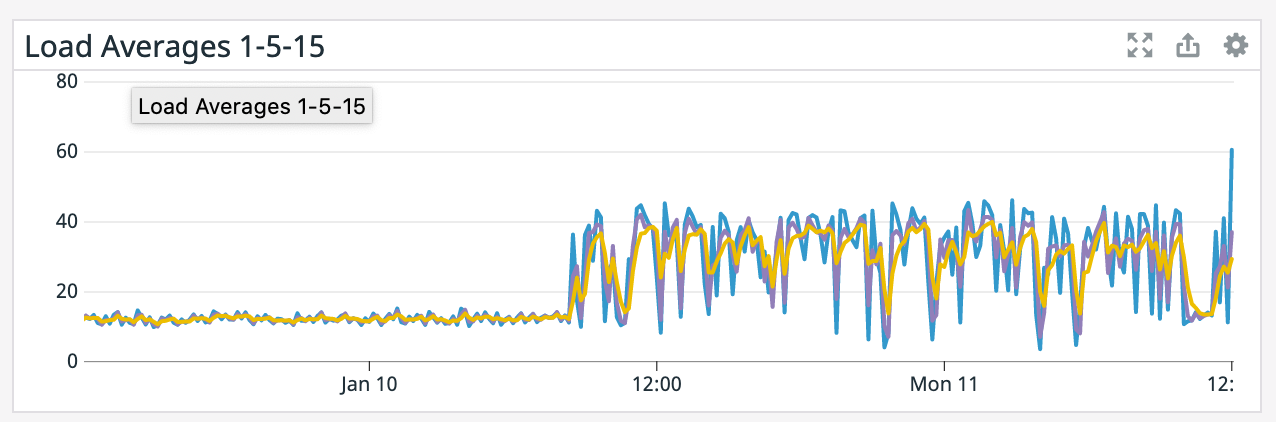
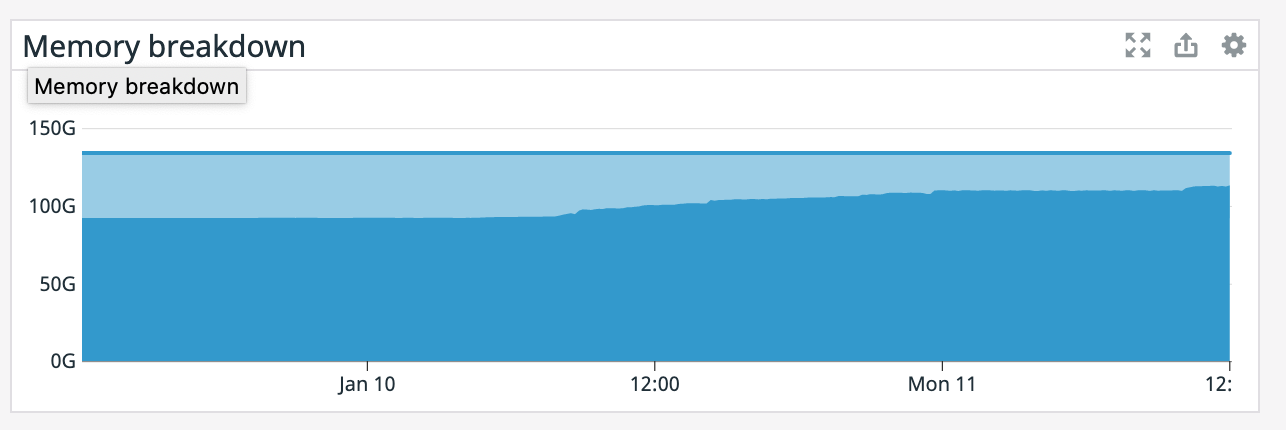
It also appears that our memory is slowly increasing since that point even though the TaskManager was giving precisely 100GB. Also, our TaskManager logs are 150 MiB which is odd. What would cause memory to go up like this?
On Mon, Jan 11, 2021 at 1:12 PM Rex Fenley <[hidden email]> wrote:
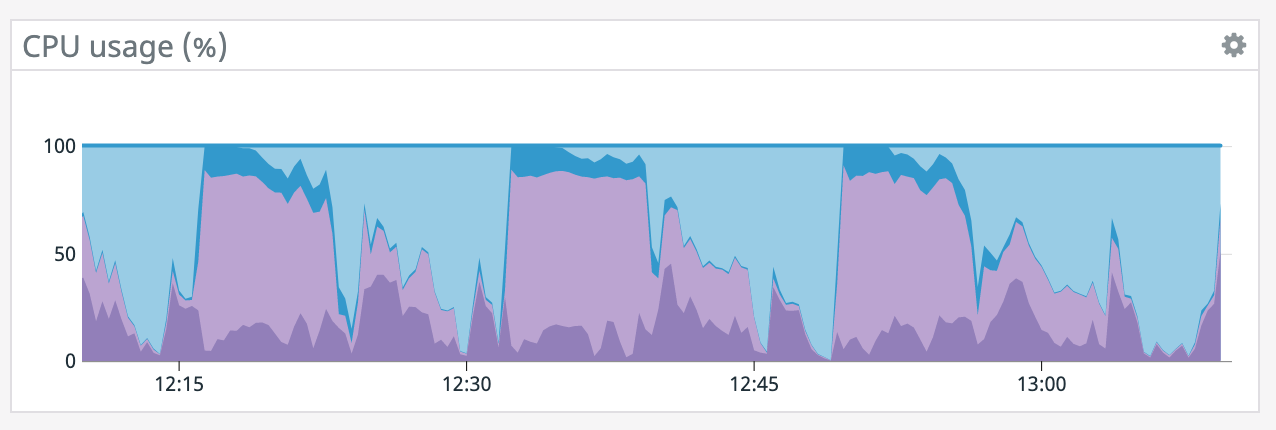
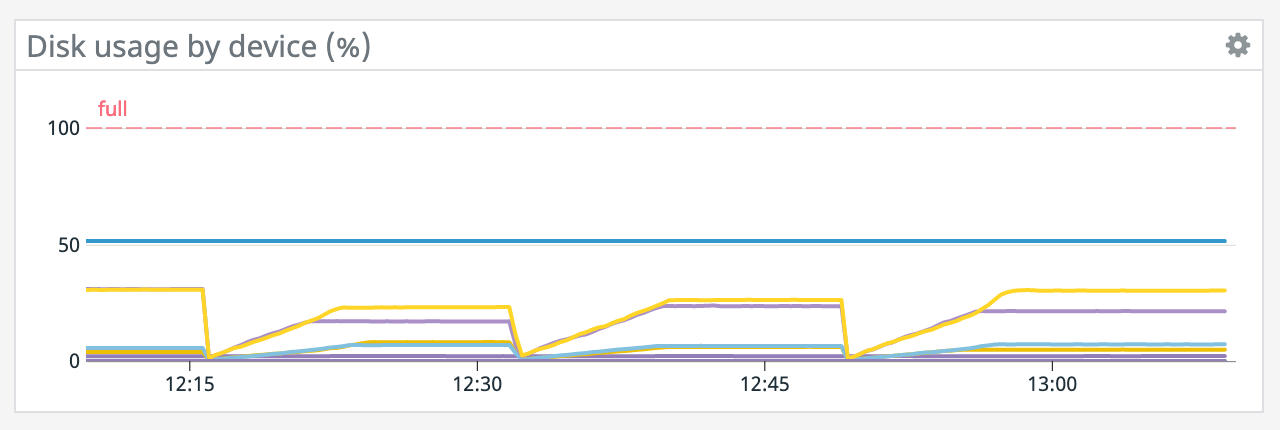
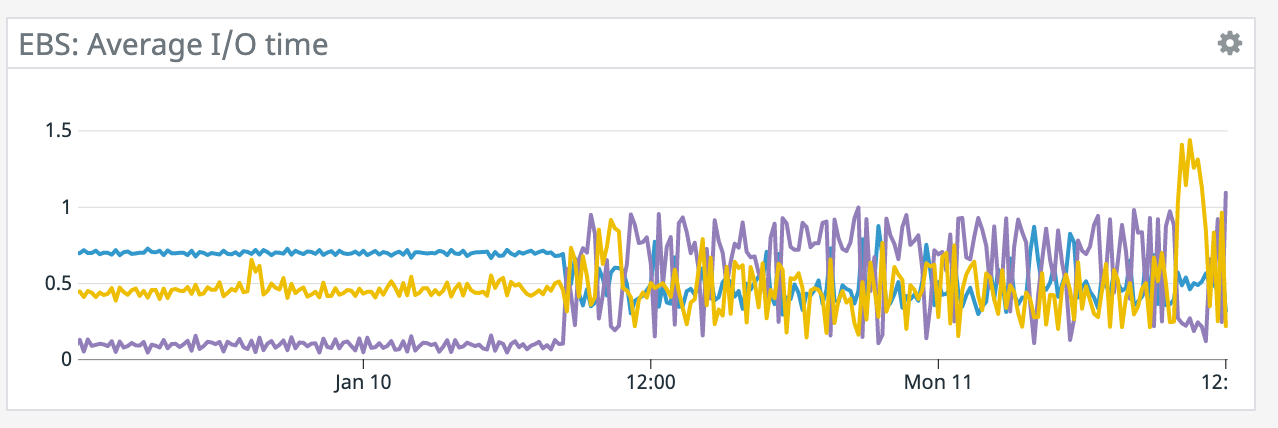
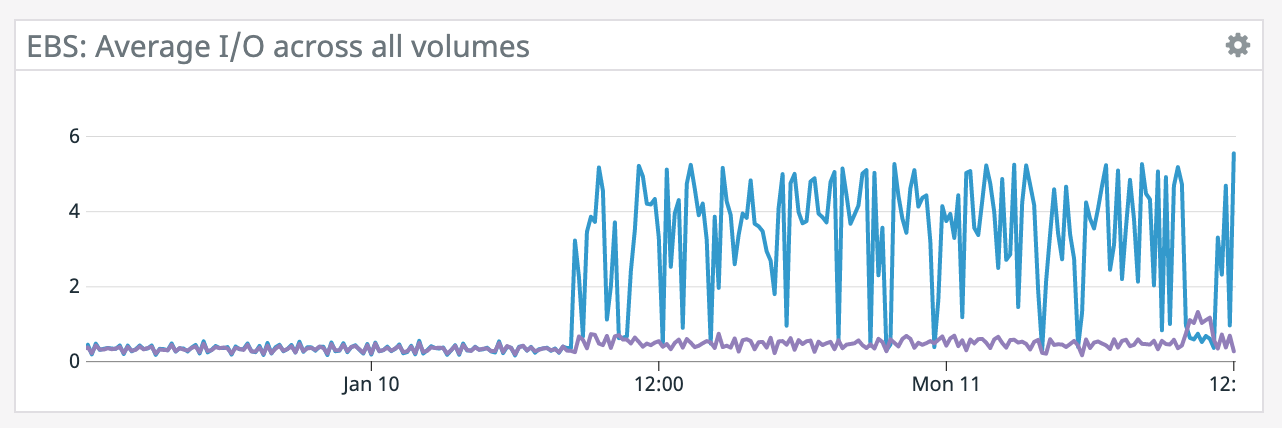
We have a job with a bunch of joins and maps from Kafka to Elasticsearch. At some point later into the initial indexing process we began seeing these odd spikey graphs below. We're curious what could have started causing this?
One interesting facet is disk usage drops an order of magnitude (.5 - 2 GiB) while running and then fires back up, holds steady during checkpointing, and then drops again during normal running (we're also trying to reduce our checkpointing times which are ~1-3 min, but that's a separate topic).
Is RocksDB compaction mechanism at play when the disk usage drops? You can see this behavior in the first 2 graphs.
Other graphs
--
Rex Fenley | Software Engineer - Mobile and Backend
Remind.com | BLOG | FOLLOW US | LIKE US
--
Rex Fenley | Software Engineer - Mobile and Backend
Remind.com | BLOG | FOLLOW US | LIKE US
--
Rex Fenley | Software Engineer - Mobile and Backend
Remind.com | BLOG | FOLLOW US | LIKE US
| Free forum by Nabble | Edit this page |