Re: Only One TaskManager Showing High CPU Usage
URL: http://deprecated-apache-flink-user-mailing-list-archive.369.s1.nabble.com/Only-One-TaskManager-Showing-High-CPU-Usage-tp37208p37227.html
Hi all,
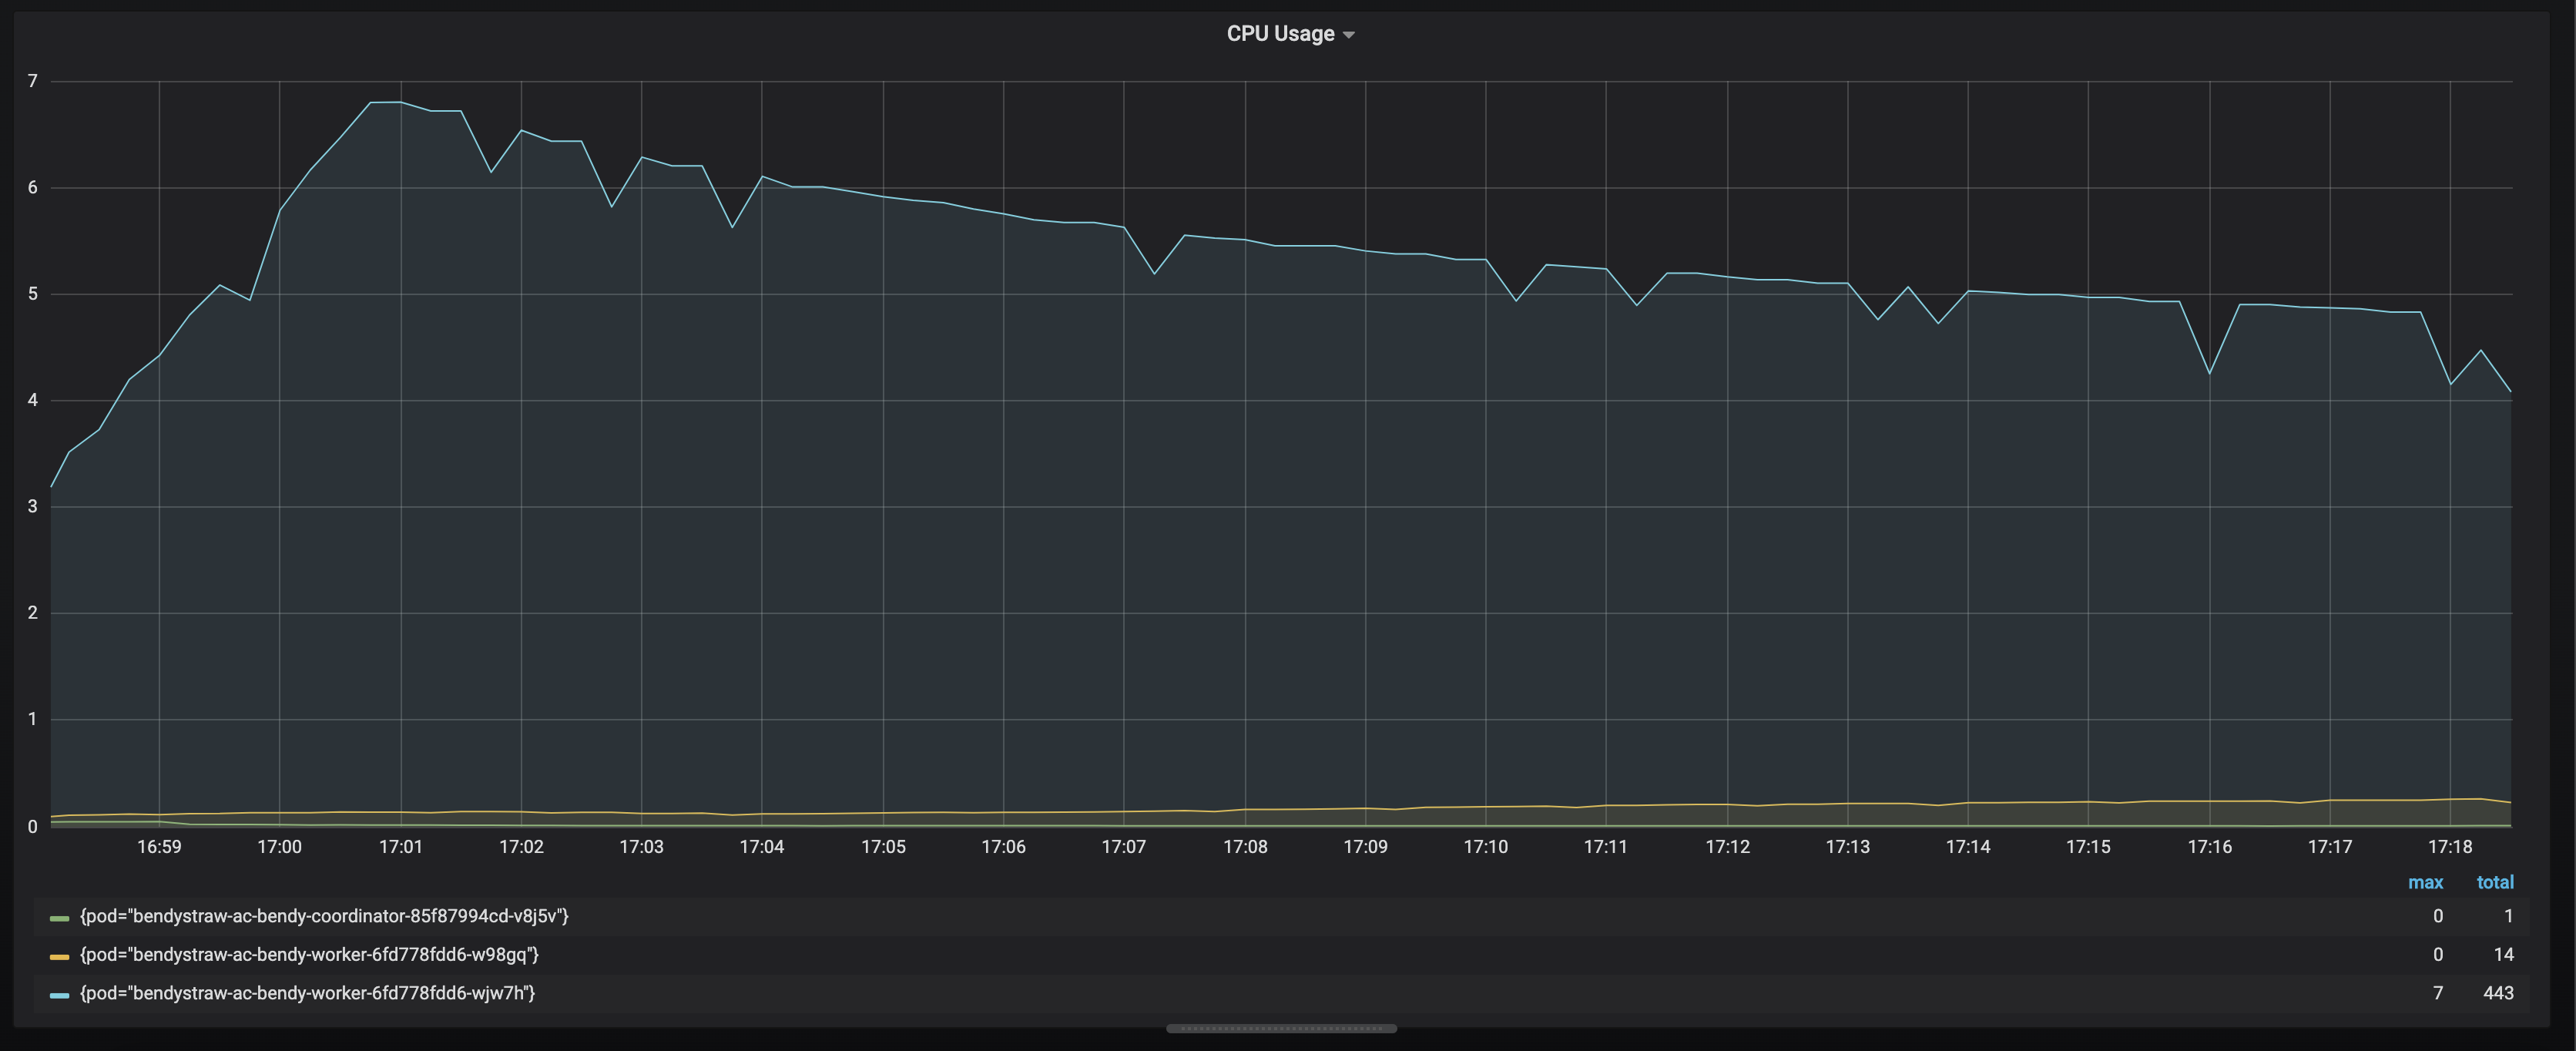
The issue is that only one out of two taskmanagers experience high cpu usage.
I’m running a series of performance tests processing records at 50k rps. In this setup, I have 1 job manager (1 core, 1 gb) and 2 task managers (8 cores, 8 gb). Each of the taskmanagers have 8 task slots and we have a simple pipeline that reads from kafka, filters, and makes a http request downstream with the asyncio function.
All operators have parallelism of 8, except the filter (parallelism of 4) and the asyncio function (parallelism of 16). We do not have checkpointing turned on.
I thought maybe the operator chaining was causing issues in distributing the load, so I disabled operator chaining after the filter (before the asyncio). However, the issue still persisted and I did see somewhat even distribution of records before and after this change.
Some potential problems: the http client is not static so it will be recreated for each parallel instance of the asyncio operator (so, there’s gonna be a lot of executors.). At the cpu peak, I see 10k threads and it steadily grows to 40k at the end of the time period shown.
Does anyone have any ideas? In the 50k rps, about 500 out of those events need to hit the asyncio function (the filter filters out the unrelated events). I was doing fine before I added the unrelated events (just the 500 rps going to asyncio).
Thanks,
Mason
| Free forum by Nabble | Edit this page |