need instruction on how the Flink metric works

classic Classic list List threaded Threaded
10 messages Options
Reply | Threaded
Open this post in threaded view
|

need instruction on how the Flink metric works

Jiewen Shao
I'm new to flink and I have read https://ci.apache.org/projects/flink/flink-docs-release-1.3/monitoring/metrics.html, I am still unclear where do I read the metrics I added. 

for example, 

public static void main(String[] args) throws Exception {


        StreamExecutionEnvironment env = StreamExecutionEnvironment.getExecutionEnvironment();

        env.setParallelism(2);


        List<String> wordList = Arrays.asList("Hive", "Presto", "Impala", "Parquet","ORC","Hadoop", "Flink", "Spark", "Storm", "Tez", "Flink");        

        DataStreamSource<String> source = env.fromCollection(wordList);

        DataStream<Tuple2<String, Integer>> dataStream = env.fromCollection(wordList).map(new WordLengthCounter());

        dataStream.print();

        env.execute();

    }


and 


public class WordLengthCounter extends RichMapFunction<String, Tuple2<String, Integer>> {


private static final long serialVersionUID = 1L;

private Counter counter;


@Override

  public void open(Configuration config) {

    this.counter = getRuntimeContext()

      .getMetricGroup()

      .counter("myCounter");

  }


@Override

public Tuple2<String, Integer> map(String value) throws Exception {

this.counter.inc();

return new Tuple2<String, Integer>(value, value.length());

}

}


Now, where do I see the counter? Sorry for the naive question


can anyone point me to any good end-to-end "hello world" example for flink metrics.
Reply | Threaded
Open this post in threaded view
|

Re: need instruction on how the Flink metric works

Michael Fong
Hi, 

You may enable metrics reporter to see the output of your metrics; counter in your example. 

There is a brief documentation regarding to metrics and reporter setup at link. The easiest approach, in my opinion, is to set up a JMX reporter so that you may see your metrics via JConsole. 

Hope this helps.

Regrads,


On Mon, Sep 18, 2017 at 10:27 AM, Jiewen Shao <[hidden email]> wrote:
I'm new to flink and I have read https://ci.apache.org/projects/flink/flink-docs-release-1.3/monitoring/metrics.html, I am still unclear where do I read the metrics I added. 

for example, 

public static void main(String[] args) throws Exception {


        StreamExecutionEnvironment env = StreamExecutionEnvironment.getExecutionEnvironment();

        env.setParallelism(2);


        List<String> wordList = Arrays.asList("Hive", "Presto", "Impala", "Parquet","ORC","Hadoop", "Flink", "Spark", "Storm", "Tez", "Flink");        

        DataStreamSource<String> source = env.fromCollection(wordList);

        DataStream<Tuple2<String, Integer>> dataStream = env.fromCollection(wordList).map(new WordLengthCounter());

        dataStream.print();

        env.execute();

    }


and 


public class WordLengthCounter extends RichMapFunction<String, Tuple2<String, Integer>> {


private static final long serialVersionUID = 1L;

private Counter counter;


@Override

  public void open(Configuration config) {

    this.counter = getRuntimeContext()

      .getMetricGroup()

      .counter("myCounter");

  }


@Override

public Tuple2<String, Integer> map(String value) throws Exception {

this.counter.inc();

return new Tuple2<String, Integer>(value, value.length());

}

}


Now, where do I see the counter? Sorry for the naive question


can anyone point me to any good end-to-end "hello world" example for flink metrics.

Reply | Threaded
Open this post in threaded view
|

Re: need instruction on how the Flink metric works

Jiewen Shao
Thanks, When I started jconsole, it listed com.apache.flink.runtime.jobmanager..:[port] as one of the Local Process, i was able to connect to it with insecure connection, but i was not able to locate the Counter metrics, I only saw some system metrics.

On Sun, Sep 17, 2017 at 7:39 PM, Michael Fong <[hidden email]> wrote:
Hi, 

You may enable metrics reporter to see the output of your metrics; counter in your example. 

There is a brief documentation regarding to metrics and reporter setup at link. The easiest approach, in my opinion, is to set up a JMX reporter so that you may see your metrics via JConsole. 

Hope this helps.

Regrads,


On Mon, Sep 18, 2017 at 10:27 AM, Jiewen Shao <[hidden email]> wrote:
I'm new to flink and I have read https://ci.apache.org/projects/flink/flink-docs-release-1.3/monitoring/metrics.html, I am still unclear where do I read the metrics I added. 

for example, 

public static void main(String[] args) throws Exception {


        StreamExecutionEnvironment env = StreamExecutionEnvironment.getExecutionEnvironment();

        env.setParallelism(2);


        List<String> wordList = Arrays.asList("Hive", "Presto", "Impala", "Parquet","ORC","Hadoop", "Flink", "Spark", "Storm", "Tez", "Flink");        

        DataStreamSource<String> source = env.fromCollection(wordList);

        DataStream<Tuple2<String, Integer>> dataStream = env.fromCollection(wordList).map(new WordLengthCounter());

        dataStream.print();

        env.execute();

    }


and 


public class WordLengthCounter extends RichMapFunction<String, Tuple2<String, Integer>> {


private static final long serialVersionUID = 1L;

private Counter counter;


@Override

  public void open(Configuration config) {

    this.counter = getRuntimeContext()

      .getMetricGroup()

      .counter("myCounter");

  }


@Override

public Tuple2<String, Integer> map(String value) throws Exception {

this.counter.inc();

return new Tuple2<String, Integer>(value, value.length());

}

}


Now, where do I see the counter? Sorry for the naive question


can anyone point me to any good end-to-end "hello world" example for flink metrics.


Reply | Threaded
Open this post in threaded view
|

Re: need instruction on how the Flink metric works

Michael Fong
Hi,

There are several possibilities: 
1. Please check if reporter is set up ( guide )
For example, I would make sure my local JMXReporter service is up and running by checking taskmanager.log and search for the line:

2017-09-18 15:18:57,174 INFO  org.apache.flink.metrics.jmx.JMXReporter                      - Started JMX server on port 28781.
2017-09-18 15:18:57,175 INFO  org.apache.flink.metrics.jmx.JMXReporter                      - Configured JMXReporter with {port:28780-28790}

If for any reason the JMX server does not start up, your might see some errors:

2017-09-18 15:26:04,743 INFO  org.apache.flink.runtime.metrics.MetricRegistry               - Configuring JMXReporter with {port=28781, class=org.apac
he.flink.metrics.jmx.JMXReporter}.
2017-09-18 15:26:04,760 ERROR org.apache.flink.runtime.metrics.MetricRegistry               - Could not instantiate metrics reporter jmx. Metrics migh
t not be exposed/reported.
java.lang.RuntimeException: Could not start JMX server on any configured port. Ports: 28781
        at org.apache.flink.metrics.jmx.JMXReporter.open(JMXReporter.java:126)
        at org.apache.flink.runtime.metrics.MetricRegistry.<init>(MetricRegistry.java:131)
        at org.apache.flink.runtime.taskexecutor.TaskManagerServices.fromConfiguration(TaskManagerServices.java:188)
        at org.apache.flink.runtime.taskmanager.TaskManager$.startTaskManagerComponentsAndActor(TaskManager.scala:1984)
        at org.apache.flink.runtime.taskmanager.TaskManager$.runTaskManager(TaskManager.scala:1823)
        at org.apache.flink.runtime.taskmanager.TaskManager$$anonfun$1.apply$mcV$sp(TaskManager.scala:1926)
        at org.apache.flink.runtime.taskmanager.TaskManager$$anonfun$1.apply(TaskManager.scala:1904)
        at org.apache.flink.runtime.taskmanager.TaskManager$$anonfun$1.apply(TaskManager.scala:1904)
        at scala.util.Try$.apply(Try.scala:192)


Here is my local setup for conf/flink-conf.yaml for example:
metrics.reporters: jmx 
metrics.reporter.jmx.class: org.apache.flink.metrics.jmx.JMXReporter
metrics.reporter.jmx.port: 28780-28790 

2. You might want to try a real streaming example which could execute continuously. If I remember correctly, when the task is completed, the manager would seem to release the associated resource and object. In your example, it is only processing a few strings, which would finish in matter of milliseconds, before bringing up jconsole manually. 

Hope some of these help,


On Mon, Sep 18, 2017 at 12:22 PM, Jiewen Shao <[hidden email]> wrote:
Thanks, When I started jconsole, it listed com.apache.flink.runtime.jobmanager..:[port] as one of the Local Process, i was able to connect to it with insecure connection, but i was not able to locate the Counter metrics, I only saw some system metrics.

On Sun, Sep 17, 2017 at 7:39 PM, Michael Fong <[hidden email]> wrote:
Hi, 

You may enable metrics reporter to see the output of your metrics; counter in your example. 

There is a brief documentation regarding to metrics and reporter setup at link. The easiest approach, in my opinion, is to set up a JMX reporter so that you may see your metrics via JConsole. 

Hope this helps.

Regrads,


On Mon, Sep 18, 2017 at 10:27 AM, Jiewen Shao <[hidden email]> wrote:
I'm new to flink and I have read https://ci.apache.org/projects/flink/flink-docs-release-1.3/monitoring/metrics.html, I am still unclear where do I read the metrics I added. 

for example, 

public static void main(String[] args) throws Exception {


        StreamExecutionEnvironment env = StreamExecutionEnvironment.getExecutionEnvironment();

        env.setParallelism(2);


        List<String> wordList = Arrays.asList("Hive", "Presto", "Impala", "Parquet","ORC","Hadoop", "Flink", "Spark", "Storm", "Tez", "Flink");        

        DataStreamSource<String> source = env.fromCollection(wordList);

        DataStream<Tuple2<String, Integer>> dataStream = env.fromCollection(wordList).map(new WordLengthCounter());

        dataStream.print();

        env.execute();

    }


and 


public class WordLengthCounter extends RichMapFunction<String, Tuple2<String, Integer>> {


private static final long serialVersionUID = 1L;

private Counter counter;


@Override

  public void open(Configuration config) {

    this.counter = getRuntimeContext()

      .getMetricGroup()

      .counter("myCounter");

  }


@Override

public Tuple2<String, Integer> map(String value) throws Exception {

this.counter.inc();

return new Tuple2<String, Integer>(value, value.length());

}

}


Now, where do I see the counter? Sorry for the naive question


can anyone point me to any good end-to-end "hello world" example for flink metrics.


Reply | Threaded
Open this post in threaded view
|

Re: need instruction on how the Flink metric works

Jiewen Shao
Still got stuck, here are my steps (on my laptop)

for example:
Step1:

public class MetricsTest<T> extends RichMapFunction<T, T> {


private static final long serialVersionUID = 1L;

private org.apache.flink.metrics.Meter meter;

    private Counter counter;


    @Override

    public void open(Configuration config) {

        this.counter = getRuntimeContext()

                .getMetricGroup()

                .counter("my-counter");


        this.meter = getRuntimeContext()

                .getMetricGroup()

                .meter("my-meter"new DropwizardMeterWrapper(new com.codahale.metrics.Meter()));

    }


    @Override

    public T map(T itemthrows Exception {

        this.counter.inc();

        this.meter.markEvent();

        return item;

    }

}


And I did followings in one of the Flink sample (SocketWindowWordCount.java):
Step2:

DataStream<String> text = env.socketTextStream("localhost", 12345, "\n");

text.map(new MetricsTest());  //<-- added this line


Step3:

mvn clean install


step4: nc -l 12345


step5:

flink run -c [my_class_name] my.jar


step6:  (type something under nc terminal)

run jconsole, and pick the local process for this "flink run", and click the tab "MBeans" (I don't see my metrics other than system ones, is that the right place to look at?)


and flink-conf.yaml has:

# metrics

metrics.reporters: jmx

metrics.reporter.jmx.class: org.apache.flink.metrics.jmx.JMXReporter

metrics.reporter.jmx.port: 28780-28790


and taskmanager log looks ok regarding JMX


did I miss steps or configurations? Thanks a lot!


On Mon, Sep 18, 2017 at 12:30 AM, Michael Fong <[hidden email]> wrote:
Hi,

There are several possibilities: 
1. Please check if reporter is set up ( guide )
For example, I would make sure my local JMXReporter service is up and running by checking taskmanager.log and search for the line:

2017-09-18 15:18:57,174 INFO  org.apache.flink.metrics.jmx.JMXReporter                      - Started JMX server on port 28781.
2017-09-18 15:18:57,175 INFO  org.apache.flink.metrics.jmx.JMXReporter                      - Configured JMXReporter with {port:28780-28790}

If for any reason the JMX server does not start up, your might see some errors:

2017-09-18 15:26:04,743 INFO  org.apache.flink.runtime.metrics.MetricRegistry               - Configuring JMXReporter with {port=28781, class=org.apac
he.flink.metrics.jmx.JMXReporter}.
2017-09-18 15:26:04,760 ERROR org.apache.flink.runtime.metrics.MetricRegistry               - Could not instantiate metrics reporter jmx. Metrics migh
t not be exposed/reported.
java.lang.RuntimeException: Could not start JMX server on any configured port. Ports: 28781
        at org.apache.flink.metrics.jmx.JMXReporter.open(JMXReporter.java:126)
        at org.apache.flink.runtime.metrics.MetricRegistry.<init>(MetricRegistry.java:131)
        at org.apache.flink.runtime.taskexecutor.TaskManagerServices.fromConfiguration(TaskManagerServices.java:188)
        at org.apache.flink.runtime.taskmanager.TaskManager$.startTaskManagerComponentsAndActor(TaskManager.scala:1984)
        at org.apache.flink.runtime.taskmanager.TaskManager$.runTaskManager(TaskManager.scala:1823)
        at org.apache.flink.runtime.taskmanager.TaskManager$$anonfun$1.apply$mcV$sp(TaskManager.scala:1926)
        at org.apache.flink.runtime.taskmanager.TaskManager$$anonfun$1.apply(TaskManager.scala:1904)
        at org.apache.flink.runtime.taskmanager.TaskManager$$anonfun$1.apply(TaskManager.scala:1904)
        at scala.util.Try$.apply(Try.scala:192)


Here is my local setup for conf/flink-conf.yaml for example:
metrics.reporters: jmx 
metrics.reporter.jmx.class: org.apache.flink.metrics.jmx.JMXReporter
metrics.reporter.jmx.port: 28780-28790 

2. You might want to try a real streaming example which could execute continuously. If I remember correctly, when the task is completed, the manager would seem to release the associated resource and object. In your example, it is only processing a few strings, which would finish in matter of milliseconds, before bringing up jconsole manually. 

Hope some of these help,


On Mon, Sep 18, 2017 at 12:22 PM, Jiewen Shao <[hidden email]> wrote:
Thanks, When I started jconsole, it listed com.apache.flink.runtime.jobmanager..:[port] as one of the Local Process, i was able to connect to it with insecure connection, but i was not able to locate the Counter metrics, I only saw some system metrics.

On Sun, Sep 17, 2017 at 7:39 PM, Michael Fong <[hidden email]> wrote:
Hi, 

You may enable metrics reporter to see the output of your metrics; counter in your example. 

There is a brief documentation regarding to metrics and reporter setup at link. The easiest approach, in my opinion, is to set up a JMX reporter so that you may see your metrics via JConsole. 

Hope this helps.

Regrads,


On Mon, Sep 18, 2017 at 10:27 AM, Jiewen Shao <[hidden email]> wrote:
I'm new to flink and I have read https://ci.apache.org/projects/flink/flink-docs-release-1.3/monitoring/metrics.html, I am still unclear where do I read the metrics I added. 

for example, 

public static void main(String[] args) throws Exception {


        StreamExecutionEnvironment env = StreamExecutionEnvironment.getExecutionEnvironment();

        env.setParallelism(2);


        List<String> wordList = Arrays.asList("Hive", "Presto", "Impala", "Parquet","ORC","Hadoop", "Flink", "Spark", "Storm", "Tez", "Flink");        

        DataStreamSource<String> source = env.fromCollection(wordList);

        DataStream<Tuple2<String, Integer>> dataStream = env.fromCollection(wordList).map(new WordLengthCounter());

        dataStream.print();

        env.execute();

    }


and 


public class WordLengthCounter extends RichMapFunction<String, Tuple2<String, Integer>> {


private static final long serialVersionUID = 1L;

private Counter counter;


@Override

  public void open(Configuration config) {

    this.counter = getRuntimeContext()

      .getMetricGroup()

      .counter("myCounter");

  }


@Override

public Tuple2<String, Integer> map(String value) throws Exception {

this.counter.inc();

return new Tuple2<String, Integer>(value, value.length());

}

}


Now, where do I see the counter? Sorry for the naive question


can anyone point me to any good end-to-end "hello world" example for flink metrics.


Reply | Threaded
Open this post in threaded view
|

Re: need instruction on how the Flink metric works

Michael Fong
I just did the same test as you had with SocketWindowWordCount, and the counter showed up all right. 

You should probably connect Jconsole to localhost:28781 (or whatever port you have your JMX server listened on)

That's how I setup the env, perhaps there is other better ways to do it. 

On Wed, Sep 20, 2017 at 9:15 AM, Jiewen Shao <[hidden email]> wrote:
Still got stuck, here are my steps (on my laptop)

for example:
Step1:

public class MetricsTest<T> extends RichMapFunction<T, T> {


private static final long serialVersionUID = 1L;

private org.apache.flink.metrics.Meter meter;

    private Counter counter;


    @Override

    public void open(Configuration config) {

        this.counter = getRuntimeContext()

                .getMetricGroup()

                .counter("my-counter");


        this.meter = getRuntimeContext()

                .getMetricGroup()

                .meter("my-meter"new DropwizardMeterWrapper(new com.codahale.metrics.Meter()));

    }


    @Override

    public T map(T itemthrows Exception {

        this.counter.inc();

        this.meter.markEvent();

        return item;

    }

}


And I did followings in one of the Flink sample (SocketWindowWordCount.java):
Step2:

DataStream<String> text = env.socketTextStream("localhost", 12345, "\n");

text.map(new MetricsTest());  //<-- added this line


Step3:

mvn clean install


step4: nc -l 12345


step5:

flink run -c [my_class_name] my.jar


step6:  (type something under nc terminal)

run jconsole, and pick the local process for this "flink run", and click the tab "MBeans" (I don't see my metrics other than system ones, is that the right place to look at?)


and flink-conf.yaml has:

# metrics

metrics.reporters: jmx

metrics.reporter.jmx.class: org.apache.flink.metrics.jmx.JMXReporter

metrics.reporter.jmx.port: 28780-28790


and taskmanager log looks ok regarding JMX


did I miss steps or configurations? Thanks a lot!


On Mon, Sep 18, 2017 at 12:30 AM, Michael Fong <[hidden email]> wrote:
Hi,

There are several possibilities: 
1. Please check if reporter is set up ( guide )
For example, I would make sure my local JMXReporter service is up and running by checking taskmanager.log and search for the line:

2017-09-18 15:18:57,174 INFO  org.apache.flink.metrics.jmx.JMXReporter                      - Started JMX server on port 28781.
2017-09-18 15:18:57,175 INFO  org.apache.flink.metrics.jmx.JMXReporter                      - Configured JMXReporter with {port:28780-28790}

If for any reason the JMX server does not start up, your might see some errors:

2017-09-18 15:26:04,743 INFO  org.apache.flink.runtime.metrics.MetricRegistry               - Configuring JMXReporter with {port=28781, class=org.apac
he.flink.metrics.jmx.JMXReporter}.
2017-09-18 15:26:04,760 ERROR org.apache.flink.runtime.metrics.MetricRegistry               - Could not instantiate metrics reporter jmx. Metrics migh
t not be exposed/reported.
java.lang.RuntimeException: Could not start JMX server on any configured port. Ports: 28781
        at org.apache.flink.metrics.jmx.JMXReporter.open(JMXReporter.java:126)
        at org.apache.flink.runtime.metrics.MetricRegistry.<init>(MetricRegistry.java:131)
        at org.apache.flink.runtime.taskexecutor.TaskManagerServices.fromConfiguration(TaskManagerServices.java:188)
        at org.apache.flink.runtime.taskmanager.TaskManager$.startTaskManagerComponentsAndActor(TaskManager.scala:1984)
        at org.apache.flink.runtime.taskmanager.TaskManager$.runTaskManager(TaskManager.scala:1823)
        at org.apache.flink.runtime.taskmanager.TaskManager$$anonfun$1.apply$mcV$sp(TaskManager.scala:1926)
        at org.apache.flink.runtime.taskmanager.TaskManager$$anonfun$1.apply(TaskManager.scala:1904)
        at org.apache.flink.runtime.taskmanager.TaskManager$$anonfun$1.apply(TaskManager.scala:1904)
        at scala.util.Try$.apply(Try.scala:192)


Here is my local setup for conf/flink-conf.yaml for example:
metrics.reporters: jmx 
metrics.reporter.jmx.class: org.apache.flink.metrics.jmx.JMXReporter
metrics.reporter.jmx.port: 28780-28790 

2. You might want to try a real streaming example which could execute continuously. If I remember correctly, when the task is completed, the manager would seem to release the associated resource and object. In your example, it is only processing a few strings, which would finish in matter of milliseconds, before bringing up jconsole manually. 

Hope some of these help,


On Mon, Sep 18, 2017 at 12:22 PM, Jiewen Shao <[hidden email]> wrote:
Thanks, When I started jconsole, it listed com.apache.flink.runtime.jobmanager..:[port] as one of the Local Process, i was able to connect to it with insecure connection, but i was not able to locate the Counter metrics, I only saw some system metrics.

On Sun, Sep 17, 2017 at 7:39 PM, Michael Fong <[hidden email]> wrote:
Hi, 

You may enable metrics reporter to see the output of your metrics; counter in your example. 

There is a brief documentation regarding to metrics and reporter setup at link. The easiest approach, in my opinion, is to set up a JMX reporter so that you may see your metrics via JConsole. 

Hope this helps.

Regrads,


On Mon, Sep 18, 2017 at 10:27 AM, Jiewen Shao <[hidden email]> wrote:
I'm new to flink and I have read https://ci.apache.org/projects/flink/flink-docs-release-1.3/monitoring/metrics.html, I am still unclear where do I read the metrics I added. 

for example, 

public static void main(String[] args) throws Exception {


        StreamExecutionEnvironment env = StreamExecutionEnvironment.getExecutionEnvironment();

        env.setParallelism(2);


        List<String> wordList = Arrays.asList("Hive", "Presto", "Impala", "Parquet","ORC","Hadoop", "Flink", "Spark", "Storm", "Tez", "Flink");        

        DataStreamSource<String> source = env.fromCollection(wordList);

        DataStream<Tuple2<String, Integer>> dataStream = env.fromCollection(wordList).map(new WordLengthCounter());

        dataStream.print();

        env.execute();

    }


and 


public class WordLengthCounter extends RichMapFunction<String, Tuple2<String, Integer>> {


private static final long serialVersionUID = 1L;

private Counter counter;


@Override

  public void open(Configuration config) {

    this.counter = getRuntimeContext()

      .getMetricGroup()

      .counter("myCounter");

  }


@Override

public Tuple2<String, Integer> map(String value) throws Exception {

this.counter.inc();

return new Tuple2<String, Integer>(value, value.length());

}

}


Now, where do I see the counter? Sorry for the naive question


can anyone point me to any good end-to-end "hello world" example for flink metrics.


Reply | Threaded
Open this post in threaded view
|

Re: need instruction on how the Flink metric works

Jiewen Shao
thats weird, I am still having trouble to see my custom metrics "my-counter" and "my-meter", I was able to see the default system metrics.
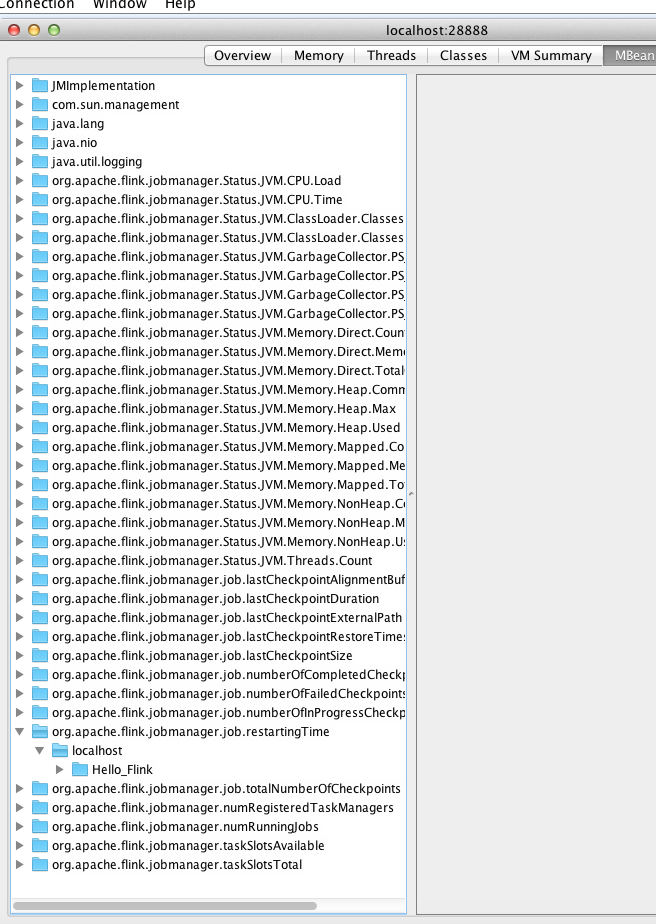
for example I have env.execute("Hello Flink"); when I connect to localhost:28888 (28888 is the port JMX listens to) I can see default flink system metrics (Hello_Flink), but just didn't see my custom metrics, I could miss something obvious. (btw, I used flink 1.2 on macbook, I started flink using start-cluster.sh), thanks!

Inline image 1

On Tue, Sep 19, 2017 at 7:07 PM, Michael Fong <[hidden email]> wrote:
I just did the same test as you had with SocketWindowWordCount, and the counter showed up all right. 

You should probably connect Jconsole to localhost:28781 (or whatever port you have your JMX server listened on)

That's how I setup the env, perhaps there is other better ways to do it. 

On Wed, Sep 20, 2017 at 9:15 AM, Jiewen Shao <[hidden email]> wrote:
Still got stuck, here are my steps (on my laptop)

for example:
Step1:

public class MetricsTest<T> extends RichMapFunction<T, T> {


private static final long serialVersionUID = 1L;

private org.apache.flink.metrics.Meter meter;

    private Counter counter;


    @Override

    public void open(Configuration config) {

        this.counter = getRuntimeContext()

                .getMetricGroup()

                .counter("my-counter");


        this.meter = getRuntimeContext()

                .getMetricGroup()

                .meter("my-meter"new DropwizardMeterWrapper(new com.codahale.metrics.Meter()));

    }


    @Override

    public T map(T itemthrows Exception {

        this.counter.inc();

        this.meter.markEvent();

        return item;

    }

}


And I did followings in one of the Flink sample (SocketWindowWordCount.java):
Step2:

DataStream<String> text = env.socketTextStream("localhost", 12345, "\n");

text.map(new MetricsTest());  //<-- added this line


Step3:

mvn clean install


step4: nc -l 12345


step5:

flink run -c [my_class_name] my.jar


step6:  (type something under nc terminal)

run jconsole, and pick the local process for this "flink run", and click the tab "MBeans" (I don't see my metrics other than system ones, is that the right place to look at?)


and flink-conf.yaml has:

# metrics

metrics.reporters: jmx

metrics.reporter.jmx.class: org.apache.flink.metrics.jmx.JMXReporter

metrics.reporter.jmx.port: 28780-28790


and taskmanager log looks ok regarding JMX


did I miss steps or configurations? Thanks a lot!


On Mon, Sep 18, 2017 at 12:30 AM, Michael Fong <[hidden email]> wrote:
Hi,

There are several possibilities: 
1. Please check if reporter is set up ( guide )
For example, I would make sure my local JMXReporter service is up and running by checking taskmanager.log and search for the line:

2017-09-18 15:18:57,174 INFO  org.apache.flink.metrics.jmx.JMXReporter                      - Started JMX server on port 28781.
2017-09-18 15:18:57,175 INFO  org.apache.flink.metrics.jmx.JMXReporter                      - Configured JMXReporter with {port:28780-28790}

If for any reason the JMX server does not start up, your might see some errors:

2017-09-18 15:26:04,743 INFO  org.apache.flink.runtime.metrics.MetricRegistry               - Configuring JMXReporter with {port=28781, class=org.apac
he.flink.metrics.jmx.JMXReporter}.
2017-09-18 15:26:04,760 ERROR org.apache.flink.runtime.metrics.MetricRegistry               - Could not instantiate metrics reporter jmx. Metrics migh
t not be exposed/reported.
java.lang.RuntimeException: Could not start JMX server on any configured port. Ports: 28781
        at org.apache.flink.metrics.jmx.JMXReporter.open(JMXReporter.java:126)
        at org.apache.flink.runtime.metrics.MetricRegistry.<init>(MetricRegistry.java:131)
        at org.apache.flink.runtime.taskexecutor.TaskManagerServices.fromConfiguration(TaskManagerServices.java:188)
        at org.apache.flink.runtime.taskmanager.TaskManager$.startTaskManagerComponentsAndActor(TaskManager.scala:1984)
        at org.apache.flink.runtime.taskmanager.TaskManager$.runTaskManager(TaskManager.scala:1823)
        at org.apache.flink.runtime.taskmanager.TaskManager$$anonfun$1.apply$mcV$sp(TaskManager.scala:1926)
        at org.apache.flink.runtime.taskmanager.TaskManager$$anonfun$1.apply(TaskManager.scala:1904)
        at org.apache.flink.runtime.taskmanager.TaskManager$$anonfun$1.apply(TaskManager.scala:1904)
        at scala.util.Try$.apply(Try.scala:192)


Here is my local setup for conf/flink-conf.yaml for example:
metrics.reporters: jmx 
metrics.reporter.jmx.class: org.apache.flink.metrics.jmx.JMXReporter
metrics.reporter.jmx.port: 28780-28790 

2. You might want to try a real streaming example which could execute continuously. If I remember correctly, when the task is completed, the manager would seem to release the associated resource and object. In your example, it is only processing a few strings, which would finish in matter of milliseconds, before bringing up jconsole manually. 

Hope some of these help,


On Mon, Sep 18, 2017 at 12:22 PM, Jiewen Shao <[hidden email]> wrote:
Thanks, When I started jconsole, it listed com.apache.flink.runtime.jobmanager..:[port] as one of the Local Process, i was able to connect to it with insecure connection, but i was not able to locate the Counter metrics, I only saw some system metrics.

On Sun, Sep 17, 2017 at 7:39 PM, Michael Fong <[hidden email]> wrote:
Hi, 

You may enable metrics reporter to see the output of your metrics; counter in your example. 

There is a brief documentation regarding to metrics and reporter setup at link. The easiest approach, in my opinion, is to set up a JMX reporter so that you may see your metrics via JConsole. 

Hope this helps.

Regrads,


On Mon, Sep 18, 2017 at 10:27 AM, Jiewen Shao <[hidden email]> wrote:
I'm new to flink and I have read https://ci.apache.org/projects/flink/flink-docs-release-1.3/monitoring/metrics.html, I am still unclear where do I read the metrics I added. 

for example, 

public static void main(String[] args) throws Exception {


        StreamExecutionEnvironment env = StreamExecutionEnvironment.getExecutionEnvironment();

        env.setParallelism(2);


        List<String> wordList = Arrays.asList("Hive", "Presto", "Impala", "Parquet","ORC","Hadoop", "Flink", "Spark", "Storm", "Tez", "Flink");        

        DataStreamSource<String> source = env.fromCollection(wordList);

        DataStream<Tuple2<String, Integer>> dataStream = env.fromCollection(wordList).map(new WordLengthCounter());

        dataStream.print();

        env.execute();

    }


and 


public class WordLengthCounter extends RichMapFunction<String, Tuple2<String, Integer>> {


private static final long serialVersionUID = 1L;

private Counter counter;


@Override

  public void open(Configuration config) {

    this.counter = getRuntimeContext()

      .getMetricGroup()

      .counter("myCounter");

  }


@Override

public Tuple2<String, Integer> map(String value) throws Exception {

this.counter.inc();

return new Tuple2<String, Integer>(value, value.length());

}

}


Now, where do I see the counter? Sorry for the naive question


can anyone point me to any good end-to-end "hello world" example for flink metrics.


Reply | Threaded
Open this post in threaded view
|

Re: need instruction on how the Flink metric works

Michael Fong
Hi, Jiewen,


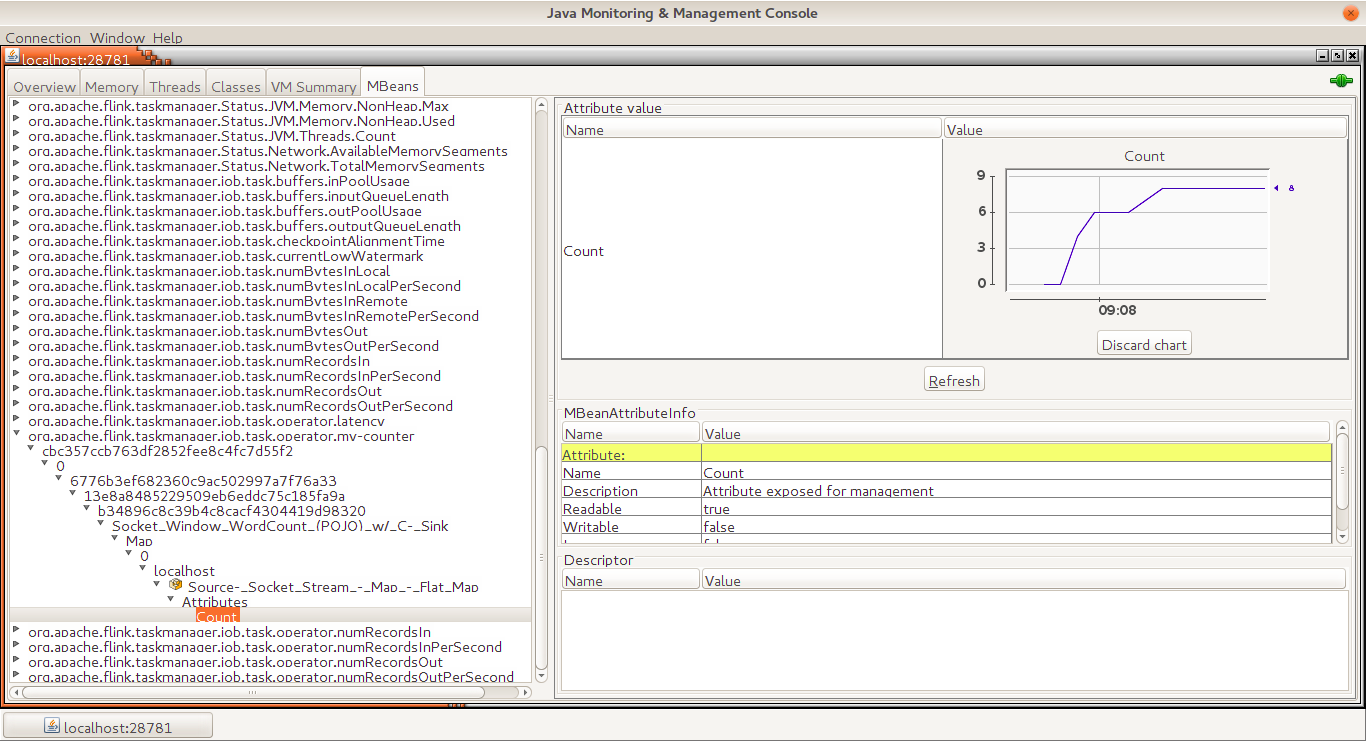
Sorry, I am not familiar with Flink v1.2 nor Mac env. I did a brief tests with Flink v1.2.1 (on Linux) with the examples you provided (counters only), the metric shows up successfully and increments as typing more words to console. Please check the following:
1. connect to the corresponding JMX server
2. Task is up and running

Inline image 1
Here is the code snippet FYI.
class MetricFunction<T> extends RichMapFunction<T, T> {

private Counter counter;

@Override
public void open(Configuration config) {
this.counter = getRuntimeContext()
.getMetricGroup()
.counter("my-counter");

}

@Override
public T map(T item) throws Exception {
this.counter.inc();
return item;
}
}
DataStream<WordCount> result = text.map(new MetricFunction<>())

.flatMap(
       ..... //test

Hope these would help,

Regards,

On Thu, Sep 21, 2017 at 3:35 AM, Jiewen Shao <[hidden email]> wrote:
thats weird, I am still having trouble to see my custom metrics "my-counter" and "my-meter", I was able to see the default system metrics.
for example I have env.execute("Hello Flink"); when I connect to localhost:28888 (28888 is the port JMX listens to) I can see default flink system metrics (Hello_Flink), but just didn't see my custom metrics, I could miss something obvious. (btw, I used flink 1.2 on macbook, I started flink using start-cluster.sh), thanks!

Inline image 1

On Tue, Sep 19, 2017 at 7:07 PM, Michael Fong <[hidden email]> wrote:
I just did the same test as you had with SocketWindowWordCount, and the counter showed up all right. 

You should probably connect Jconsole to localhost:28781 (or whatever port you have your JMX server listened on)

That's how I setup the env, perhaps there is other better ways to do it. 

On Wed, Sep 20, 2017 at 9:15 AM, Jiewen Shao <[hidden email]> wrote:
Still got stuck, here are my steps (on my laptop)

for example:
Step1:

public class MetricsTest<T> extends RichMapFunction<T, T> {


private static final long serialVersionUID = 1L;

private org.apache.flink.metrics.Meter meter;

    private Counter counter;


    @Override

    public void open(Configuration config) {

        this.counter = getRuntimeContext()

                .getMetricGroup()

                .counter("my-counter");


        this.meter = getRuntimeContext()

                .getMetricGroup()

                .meter("my-meter"new DropwizardMeterWrapper(new com.codahale.metrics.Meter()));

    }


    @Override

    public T map(T itemthrows Exception {

        this.counter.inc();

        this.meter.markEvent();

        return item;

    }

}


And I did followings in one of the Flink sample (SocketWindowWordCount.java):
Step2:

DataStream<String> text = env.socketTextStream("localhost", 12345, "\n");

text.map(new MetricsTest());  //<-- added this line


Step3:

mvn clean install


step4: nc -l 12345


step5:

flink run -c [my_class_name] my.jar


step6:  (type something under nc terminal)

run jconsole, and pick the local process for this "flink run", and click the tab "MBeans" (I don't see my metrics other than system ones, is that the right place to look at?)


and flink-conf.yaml has:

# metrics

metrics.reporters: jmx

metrics.reporter.jmx.class: org.apache.flink.metrics.jmx.JMXReporter

metrics.reporter.jmx.port: 28780-28790


and taskmanager log looks ok regarding JMX


did I miss steps or configurations? Thanks a lot!


On Mon, Sep 18, 2017 at 12:30 AM, Michael Fong <[hidden email]> wrote:
Hi,

There are several possibilities: 
1. Please check if reporter is set up ( guide )
For example, I would make sure my local JMXReporter service is up and running by checking taskmanager.log and search for the line:

2017-09-18 15:18:57,174 INFO  org.apache.flink.metrics.jmx.JMXReporter                      - Started JMX server on port 28781.
2017-09-18 15:18:57,175 INFO  org.apache.flink.metrics.jmx.JMXReporter                      - Configured JMXReporter with {port:28780-28790}

If for any reason the JMX server does not start up, your might see some errors:

2017-09-18 15:26:04,743 INFO  org.apache.flink.runtime.metrics.MetricRegistry               - Configuring JMXReporter with {port=28781, class=org.apac
he.flink.metrics.jmx.JMXReporter}.
2017-09-18 15:26:04,760 ERROR org.apache.flink.runtime.metrics.MetricRegistry               - Could not instantiate metrics reporter jmx. Metrics migh
t not be exposed/reported.
java.lang.RuntimeException: Could not start JMX server on any configured port. Ports: 28781
        at org.apache.flink.metrics.jmx.JMXReporter.open(JMXReporter.java:126)
        at org.apache.flink.runtime.metrics.MetricRegistry.<init>(MetricRegistry.java:131)
        at org.apache.flink.runtime.taskexecutor.TaskManagerServices.fromConfiguration(TaskManagerServices.java:188)
        at org.apache.flink.runtime.taskmanager.TaskManager$.startTaskManagerComponentsAndActor(TaskManager.scala:1984)
        at org.apache.flink.runtime.taskmanager.TaskManager$.runTaskManager(TaskManager.scala:1823)
        at org.apache.flink.runtime.taskmanager.TaskManager$$anonfun$1.apply$mcV$sp(TaskManager.scala:1926)
        at org.apache.flink.runtime.taskmanager.TaskManager$$anonfun$1.apply(TaskManager.scala:1904)
        at org.apache.flink.runtime.taskmanager.TaskManager$$anonfun$1.apply(TaskManager.scala:1904)
        at scala.util.Try$.apply(Try.scala:192)


Here is my local setup for conf/flink-conf.yaml for example:
metrics.reporters: jmx 
metrics.reporter.jmx.class: org.apache.flink.metrics.jmx.JMXReporter
metrics.reporter.jmx.port: 28780-28790 

2. You might want to try a real streaming example which could execute continuously. If I remember correctly, when the task is completed, the manager would seem to release the associated resource and object. In your example, it is only processing a few strings, which would finish in matter of milliseconds, before bringing up jconsole manually. 

Hope some of these help,


On Mon, Sep 18, 2017 at 12:22 PM, Jiewen Shao <[hidden email]> wrote:
Thanks, When I started jconsole, it listed com.apache.flink.runtime.jobmanager..:[port] as one of the Local Process, i was able to connect to it with insecure connection, but i was not able to locate the Counter metrics, I only saw some system metrics.

On Sun, Sep 17, 2017 at 7:39 PM, Michael Fong <[hidden email]> wrote:
Hi, 

You may enable metrics reporter to see the output of your metrics; counter in your example. 

There is a brief documentation regarding to metrics and reporter setup at link. The easiest approach, in my opinion, is to set up a JMX reporter so that you may see your metrics via JConsole. 

Hope this helps.

Regrads,


On Mon, Sep 18, 2017 at 10:27 AM, Jiewen Shao <[hidden email]> wrote:
I'm new to flink and I have read https://ci.apache.org/projects/flink/flink-docs-release-1.3/monitoring/metrics.html, I am still unclear where do I read the metrics I added. 

for example, 

public static void main(String[] args) throws Exception {


        StreamExecutionEnvironment env = StreamExecutionEnvironment.getExecutionEnvironment();

        env.setParallelism(2);


        List<String> wordList = Arrays.asList("Hive", "Presto", "Impala", "Parquet","ORC","Hadoop", "Flink", "Spark", "Storm", "Tez", "Flink");        

        DataStreamSource<String> source = env.fromCollection(wordList);

        DataStream<Tuple2<String, Integer>> dataStream = env.fromCollection(wordList).map(new WordLengthCounter());

        dataStream.print();

        env.execute();

    }


and 


public class WordLengthCounter extends RichMapFunction<String, Tuple2<String, Integer>> {


private static final long serialVersionUID = 1L;

private Counter counter;


@Override

  public void open(Configuration config) {

    this.counter = getRuntimeContext()

      .getMetricGroup()

      .counter("myCounter");

  }


@Override

public Tuple2<String, Integer> map(String value) throws Exception {

this.counter.inc();

return new Tuple2<String, Integer>(value, value.length());

}

}


Now, where do I see the counter? Sorry for the naive question


can anyone point me to any good end-to-end "hello world" example for flink metrics.


Screenshot from 2017-09-22 09-08-42.png (161K) Download Attachment
Reply | Threaded
Open this post in threaded view
|

Re: need instruction on how the Flink metric works

Chesnay Schepler
Hello Jiewen,

you are connection to the wrong JVM. Metrics are exposed on each Job- and TaskManager separately, meaning you have to connect to the TaskManager JVM instead of the JobManager JVM.

On 22.09.2017 03:45, Michael Fong wrote:
Hi, Jiewen,


Sorry, I am not familiar with Flink v1.2 nor Mac env. I did a brief tests with Flink v1.2.1 (on Linux) with the examples you provided (counters only), the metric shows up successfully and increments as typing more words to console. Please check the following:
1. connect to the corresponding JMX server
2. Task is up and running

Inline image 1
Here is the code snippet FYI.
class MetricFunction<T> extends RichMapFunction<T, T> {

    private Counter counter;

       @Override
       public void open(Configuration config) {
           this.counter = getRuntimeContext()
                   .getMetricGroup()
                   .counter("my-counter");

       }

       @Override
       public T map(T item) throws Exception {
           this.counter.inc();
           return item;
       }
   }
DataStream<WordCount> result = text.map(new MetricFunction<>())

      .flatMap(
       ..... //test

Hope these would help,

Regards,

On Thu, Sep 21, 2017 at 3:35 AM, Jiewen Shao <[hidden email]> wrote:
thats weird, I am still having trouble to see my custom metrics "my-counter" and "my-meter", I was able to see the default system metrics.
for example I have env.execute("Hello Flink"); when I connect to localhost:28888 (28888 is the port JMX listens to) I can see default flink system metrics (Hello_Flink), but just didn't see my custom metrics, I could miss something obvious. (btw, I used flink 1.2 on macbook, I started flink using start-cluster.sh), thanks!

Inline image 1

On Tue, Sep 19, 2017 at 7:07 PM, Michael Fong <[hidden email]> wrote:
I just did the same test as you had with SocketWindowWordCount, and the counter showed up all right. 

You should probably connect Jconsole to localhost:28781 (or whatever port you have your JMX server listened on)

That's how I setup the env, perhaps there is other better ways to do it. 

On Wed, Sep 20, 2017 at 9:15 AM, Jiewen Shao <[hidden email]> wrote:
Still got stuck, here are my steps (on my laptop)

for example:
Step1:

public class MetricsTest<T> extends RichMapFunction<T, T> {


private static final long serialVersionUID = 1L;

private org.apache.flink.metrics.Meter meter;

    private Counter counter;


    @Override

    public void open(Configuration config) {

        this.counter = getRuntimeContext()

                .getMetricGroup()

                .counter("my-counter");


        this.meter = getRuntimeContext()

                .getMetricGroup()

                .meter("my-meter"new DropwizardMeterWrapper(new com.codahale.metrics.Meter()));

    }


    @Override

    public T map(T itemthrows Exception {

        this.counter.inc();

        this.meter.markEvent();

        return item;

    }

}


And I did followings in one of the Flink sample (SocketWindowWordCount.java):
Step2:

DataStream<String> text = env.socketTextStream("localhost", 12345, "\n");

text.map(new MetricsTest());  //<-- added this line


Step3:

mvn clean install


step4: nc -l 12345


step5:

flink run -c [my_class_name] my.jar


step6:  (type something under nc terminal)

run jconsole, and pick the local process for this "flink run", and click the tab "MBeans" (I don't see my metrics other than system ones, is that the right place to look at?)


and flink-conf.yaml has:

# metrics

metrics.reporters: jmx

metrics.reporter.jmx.class: org.apache.flink.metrics.jmx.JMXReporter

metrics.reporter.jmx.port: 28780-28790


and taskmanager log looks ok regarding JMX


did I miss steps or configurations? Thanks a lot!


On Mon, Sep 18, 2017 at 12:30 AM, Michael Fong <[hidden email]> wrote:
Hi,

There are several possibilities: 
1. Please check if reporter is set up ( guide )
For example, I would make sure my local JMXReporter service is up and running by checking taskmanager.log and search for the line:

2017-09-18 15:18:57,174 INFO  org.apache.flink.metrics.jmx.JMXReporter                      - Started JMX server on port 28781.
2017-09-18 15:18:57,175 INFO  org.apache.flink.metrics.jmx.JMXReporter                      - Configured JMXReporter with {port:28780-28790}

If for any reason the JMX server does not start up, your might see some errors:

2017-09-18 15:26:04,743 INFO  org.apache.flink.runtime.metrics.MetricRegistry               - Configuring JMXReporter with {port=28781, class=org.apac
he.flink.metrics.jmx.JMXReporter}.
2017-09-18 15:26:04,760 ERROR org.apache.flink.runtime.metrics.MetricRegistry               - Could not instantiate metrics reporter jmx. Metrics migh
t not be exposed/reported.
java.lang.RuntimeException: Could not start JMX server on any configured port. Ports: 28781
        at org.apache.flink.metrics.jmx.JMXReporter.open(JMXReporter.java:126)
        at org.apache.flink.runtime.metrics.MetricRegistry.<init>(MetricRegistry.java:131)
        at org.apache.flink.runtime.taskexecutor.TaskManagerServices.fromConfiguration(TaskManagerServices.java:188)
        at org.apache.flink.runtime.taskmanager.TaskManager$.startTaskManagerComponentsAndActor(TaskManager.scala:1984)
        at org.apache.flink.runtime.taskmanager.TaskManager$.runTaskManager(TaskManager.scala:1823)
        at org.apache.flink.runtime.taskmanager.TaskManager$$anonfun$1.apply$mcV$sp(TaskManager.scala:1926)
        at org.apache.flink.runtime.taskmanager.TaskManager$$anonfun$1.apply(TaskManager.scala:1904)
        at org.apache.flink.runtime.taskmanager.TaskManager$$anonfun$1.apply(TaskManager.scala:1904)
        at scala.util.Try$.apply(Try.scala:192)


Here is my local setup for conf/flink-conf.yaml for example:
metrics.reporters: jmx 
metrics.reporter.jmx.class: org.apache.flink.metrics.jmx.JMXReporter
metrics.reporter.jmx.port: 28780-28790 

2. You might want to try a real streaming example which could execute continuously. If I remember correctly, when the task is completed, the manager would seem to release the associated resource and object. In your example, it is only processing a few strings, which would finish in matter of milliseconds, before bringing up jconsole manually. 

Hope some of these help,


On Mon, Sep 18, 2017 at 12:22 PM, Jiewen Shao <[hidden email]> wrote:
Thanks, When I started jconsole, it listed com.apache.flink.runtime.jobmanager..:[port] as one of the Local Process, i was able to connect to it with insecure connection, but i was not able to locate the Counter metrics, I only saw some system metrics.

On Sun, Sep 17, 2017 at 7:39 PM, Michael Fong <[hidden email]> wrote:
Hi, 

You may enable metrics reporter to see the output of your metrics; counter in your example. 

There is a brief documentation regarding to metrics and reporter setup at link. The easiest approach, in my opinion, is to set up a JMX reporter so that you may see your metrics via JConsole. 

Hope this helps.

Regrads,


On Mon, Sep 18, 2017 at 10:27 AM, Jiewen Shao <[hidden email]> wrote:
I'm new to flink and I have read https://ci.apache.org/projects/flink/flink-docs-release-1.3/monitoring/metrics.html, I am still unclear where do I read the metrics I added. 

for example, 

public static void main(String[] args) throws Exception {


        StreamExecutionEnvironment env = StreamExecutionEnvironment.getExecutionEnvironment();

        env.setParallelism(2);


        List<String> wordList = Arrays.asList("Hive", "Presto", "Impala", "Parquet","ORC","Hadoop", "Flink", "Spark", "Storm", "Tez", "Flink");        

        DataStreamSource<String> source = env.fromCollection(wordList);

        DataStream<Tuple2<String, Integer>> dataStream = env.fromCollection(wordList).map(new WordLengthCounter());

        dataStream.print();

        env.execute();

    }


and 


public class WordLengthCounter extends RichMapFunction<String, Tuple2<String, Integer>> {


private static final long serialVersionUID = 1L;

private Counter counter;


@Override

  public void open(Configuration config) {

    this.counter = getRuntimeContext()

      .getMetricGroup()

      .counter("myCounter");

  }


@Override

public Tuple2<String, Integer> map(String value) throws Exception {

this.counter.inc();

return new Tuple2<String, Integer>(value, value.length());

}

}


Now, where do I see the counter? Sorry for the naive question


can anyone point me to any good end-to-end "hello world" example for flink metrics.


Reply | Threaded
Open this post in threaded view
|

Re: need instruction on how the Flink metric works

Jiewen Shao
hi, Michael & Chesnay, 
Thanks a lot for the help, solved!

On Fri, Sep 22, 2017 at 6:58 AM, Chesnay Schepler <[hidden email]> wrote:
Hello Jiewen,

you are connection to the wrong JVM. Metrics are exposed on each Job- and TaskManager separately, meaning you have to connect to the TaskManager JVM instead of the JobManager JVM.


On 22.09.2017 03:45, Michael Fong wrote:
Hi, Jiewen,


Sorry, I am not familiar with Flink v1.2 nor Mac env. I did a brief tests with Flink v1.2.1 (on Linux) with the examples you provided (counters only), the metric shows up successfully and increments as typing more words to console. Please check the following:
1. connect to the corresponding JMX server
2. Task is up and running

Inline image 1
Here is the code snippet FYI.
class MetricFunction<T> extends RichMapFunction<T, T> {

    private Counter counter;

       @Override
       public void open(Configuration config) {
           this.counter = getRuntimeContext()
                   .getMetricGroup()
                   .counter("my-counter");

       }

       @Override
       public T map(T item) throws Exception {
           this.counter.inc();
           return item;
       }
   }
DataStream<WordCount> result = text.map(new MetricFunction<>())

      .flatMap(
       ..... //test

Hope these would help,

Regards,

On Thu, Sep 21, 2017 at 3:35 AM, Jiewen Shao <[hidden email]> wrote:
thats weird, I am still having trouble to see my custom metrics "my-counter" and "my-meter", I was able to see the default system metrics.
for example I have env.execute("Hello Flink"); when I connect to localhost:28888 (28888 is the port JMX listens to) I can see default flink system metrics (Hello_Flink), but just didn't see my custom metrics, I could miss something obvious. (btw, I used flink 1.2 on macbook, I started flink using start-cluster.sh), thanks!

Inline image 1

On Tue, Sep 19, 2017 at 7:07 PM, Michael Fong <[hidden email]> wrote:
I just did the same test as you had with SocketWindowWordCount, and the counter showed up all right. 

You should probably connect Jconsole to localhost:28781 (or whatever port you have your JMX server listened on)

That's how I setup the env, perhaps there is other better ways to do it. 

On Wed, Sep 20, 2017 at 9:15 AM, Jiewen Shao <[hidden email]> wrote:
Still got stuck, here are my steps (on my laptop)

for example:
Step1:

public class MetricsTest<T> extends RichMapFunction<T, T> {


private static final long serialVersionUID = 1L;

private org.apache.flink.metrics.Meter meter;

    private Counter counter;


    @Override

    public void open(Configuration config) {

        this.counter = getRuntimeContext()

                .getMetricGroup()

                .counter("my-counter");


        this.meter = getRuntimeContext()

                .getMetricGroup()

                .meter("my-meter"new DropwizardMeterWrapper(new com.codahale.metrics.Meter()));

    }


    @Override

    public T map(T itemthrows Exception {

        this.counter.inc();

        this.meter.markEvent();

        return item;

    }

}


And I did followings in one of the Flink sample (SocketWindowWordCount.java):
Step2:

DataStream<String> text = env.socketTextStream("localhost", 12345, "\n");

text.map(new MetricsTest());  //<-- added this line


Step3:

mvn clean install


step4: nc -l 12345


step5:

flink run -c [my_class_name] my.jar


step6:  (type something under nc terminal)

run jconsole, and pick the local process for this "flink run", and click the tab "MBeans" (I don't see my metrics other than system ones, is that the right place to look at?)


and flink-conf.yaml has:

# metrics

metrics.reporters: jmx

metrics.reporter.jmx.class: org.apache.flink.metrics.jmx.JMXReporter

metrics.reporter.jmx.port: 28780-28790


and taskmanager log looks ok regarding JMX


did I miss steps or configurations? Thanks a lot!


On Mon, Sep 18, 2017 at 12:30 AM, Michael Fong <[hidden email]> wrote:
Hi,

There are several possibilities: 
1. Please check if reporter is set up ( guide )
For example, I would make sure my local JMXReporter service is up and running by checking taskmanager.log and search for the line:

2017-09-18 15:18:57,174 INFO  org.apache.flink.metrics.jmx.JMXReporter                      - Started JMX server on port 28781.
2017-09-18 15:18:57,175 INFO  org.apache.flink.metrics.jmx.JMXReporter                      - Configured JMXReporter with {port:28780-28790}

If for any reason the JMX server does not start up, your might see some errors:

2017-09-18 15:26:04,743 INFO  org.apache.flink.runtime.metrics.MetricRegistry               - Configuring JMXReporter with {port=28781, class=org.apac
he.flink.metrics.jmx.JMXReporter}.
2017-09-18 15:26:04,760 ERROR org.apache.flink.runtime.metrics.MetricRegistry               - Could not instantiate metrics reporter jmx. Metrics migh
t not be exposed/reported.
java.lang.RuntimeException: Could not start JMX server on any configured port. Ports: 28781
        at org.apache.flink.metrics.jmx.JMXReporter.open(JMXReporter.java:126)
        at org.apache.flink.runtime.metrics.MetricRegistry.<init>(MetricRegistry.java:131)
        at org.apache.flink.runtime.taskexecutor.TaskManagerServices.fromConfiguration(TaskManagerServices.java:188)
        at org.apache.flink.runtime.taskmanager.TaskManager$.startTaskManagerComponentsAndActor(TaskManager.scala:1984)
        at org.apache.flink.runtime.taskmanager.TaskManager$.runTaskManager(TaskManager.scala:1823)
        at org.apache.flink.runtime.taskmanager.TaskManager$$anonfun$1.apply$mcV$sp(TaskManager.scala:1926)
        at org.apache.flink.runtime.taskmanager.TaskManager$$anonfun$1.apply(TaskManager.scala:1904)
        at org.apache.flink.runtime.taskmanager.TaskManager$$anonfun$1.apply(TaskManager.scala:1904)
        at scala.util.Try$.apply(Try.scala:192)


Here is my local setup for conf/flink-conf.yaml for example:
metrics.reporters: jmx 
metrics.reporter.jmx.class: org.apache.flink.metrics.jmx.JMXReporter
metrics.reporter.jmx.port: 28780-28790 

2. You might want to try a real streaming example which could execute continuously. If I remember correctly, when the task is completed, the manager would seem to release the associated resource and object. In your example, it is only processing a few strings, which would finish in matter of milliseconds, before bringing up jconsole manually. 

Hope some of these help,


On Mon, Sep 18, 2017 at 12:22 PM, Jiewen Shao <[hidden email]> wrote:
Thanks, When I started jconsole, it listed com.apache.flink.runtime.jobmanager..:[port] as one of the Local Process, i was able to connect to it with insecure connection, but i was not able to locate the Counter metrics, I only saw some system metrics.

On Sun, Sep 17, 2017 at 7:39 PM, Michael Fong <[hidden email]> wrote:
Hi, 

You may enable metrics reporter to see the output of your metrics; counter in your example. 

There is a brief documentation regarding to metrics and reporter setup at link. The easiest approach, in my opinion, is to set up a JMX reporter so that you may see your metrics via JConsole. 

Hope this helps.

Regrads,


On Mon, Sep 18, 2017 at 10:27 AM, Jiewen Shao <[hidden email]> wrote:
I'm new to flink and I have read https://ci.apache.org/projects/flink/flink-docs-release-1.3/monitoring/metrics.html, I am still unclear where do I read the metrics I added. 

for example, 

public static void main(String[] args) throws Exception {


        StreamExecutionEnvironment env = StreamExecutionEnvironment.getExecutionEnvironment();

        env.setParallelism(2);


        List<String> wordList = Arrays.asList("Hive", "Presto", "Impala", "Parquet","ORC","Hadoop", "Flink", "Spark", "Storm", "Tez", "Flink");        

        DataStreamSource<String> source = env.fromCollection(wordList);

        DataStream<Tuple2<String, Integer>> dataStream = env.fromCollection(wordList).map(new WordLengthCounter());

        dataStream.print();

        env.execute();

    }


and 


public class WordLengthCounter extends RichMapFunction<String, Tuple2<String, Integer>> {


private static final long serialVersionUID = 1L;

private Counter counter;


@Override

  public void open(Configuration config) {

    this.counter = getRuntimeContext()

      .getMetricGroup()

      .counter("myCounter");

  }


@Override

public Tuple2<String, Integer> map(String value) throws Exception {

this.counter.inc();

return new Tuple2<String, Integer>(value, value.length());

}

}


Now, where do I see the counter? Sorry for the naive question


can anyone point me to any good end-to-end "hello world" example for flink metrics.