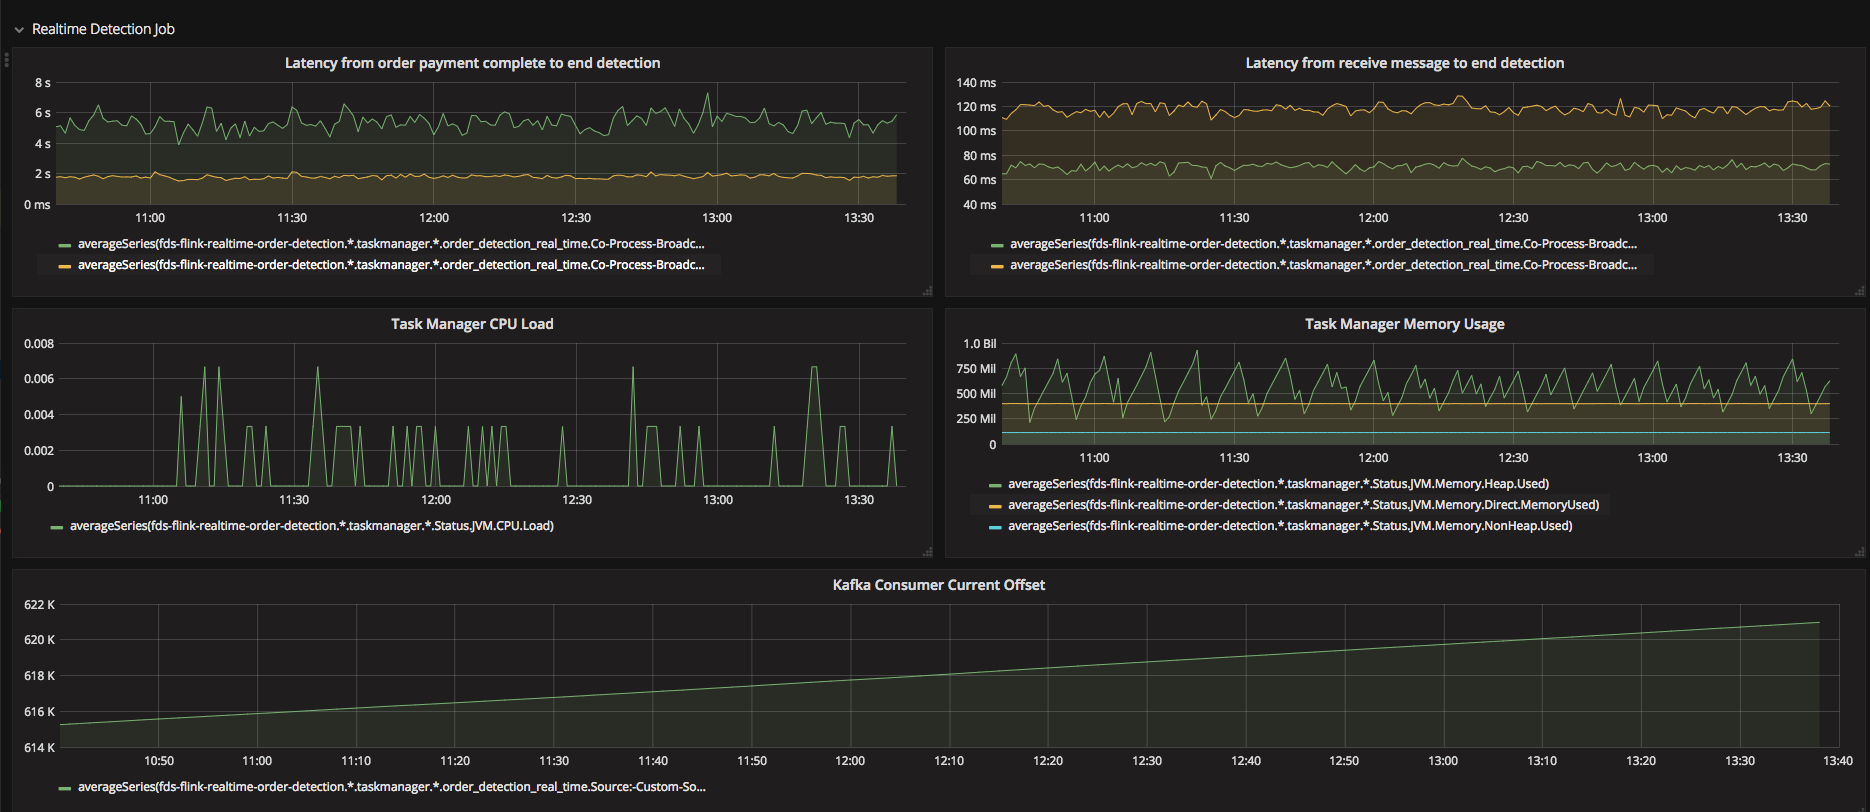
metrics displays on and off when integrate Flink metrics with graphite/Grafana
metrics displays on and off when integrate Flink metrics with graphite/Grafana
|
Hi: I try integrate flink application metrics with graphite/grafana. Currently, I have 3 flink application, 2 jobs just consume kafka message and do some business logic, another jobs use flink sql over window with watermark, out of orderness time set to 10 seconds When I send 3 application metrics to graphite. The previous 2 job shows all metrics with complete curve but the job with sql and wm’s metrics show in UI is on and off
Has anyone ever met this issue? Regards James |
Re: metrics displays on and off when integrate Flink metrics with graphite/Grafana
|
Here is my flink reporter metrics.reporters: graphite metrics.reporter.graphite.class: org.apache.flink.metrics.graphite.GraphiteReporter metrics.reporter.graphite.host: metriccollect.coupang.net metrics.reporter.graphite.port: 2003 metrics.reporter.graphite.interval: 60 SECONDS metrics.reporter.graphite.prefix: fds-flink flink version 1.5.3 From: "James (Jian Wu) [FDS Data Platform]" <[hidden email]> Hi: I try integrate flink application metrics with graphite/grafana. Currently, I have 3 flink application, 2 jobs just consume kafka message and do some business logic, another jobs use flink sql over window with watermark, out of orderness time set to 10 seconds When I send 3 application metrics to graphite. The previous 2 job shows all metrics with complete curve but the job with sql and wm’s metrics show in UI is on and off
Has anyone ever met this issue? Regards James |
|
This is definitely strange and we run hundreds SQL applications but I've never seen such stats. Would you mind trying your windowing logic in TableAPI or even DataStream API ? Thanks, Rong On Mon, Sep 10, 2018 at 10:46 PM James (Jian Wu) [FDS Data Platform] <[hidden email]> wrote:
|
| Free forum by Nabble | Edit this page |


