Wired pattern of syncing Kafka to Elasticsearch


|
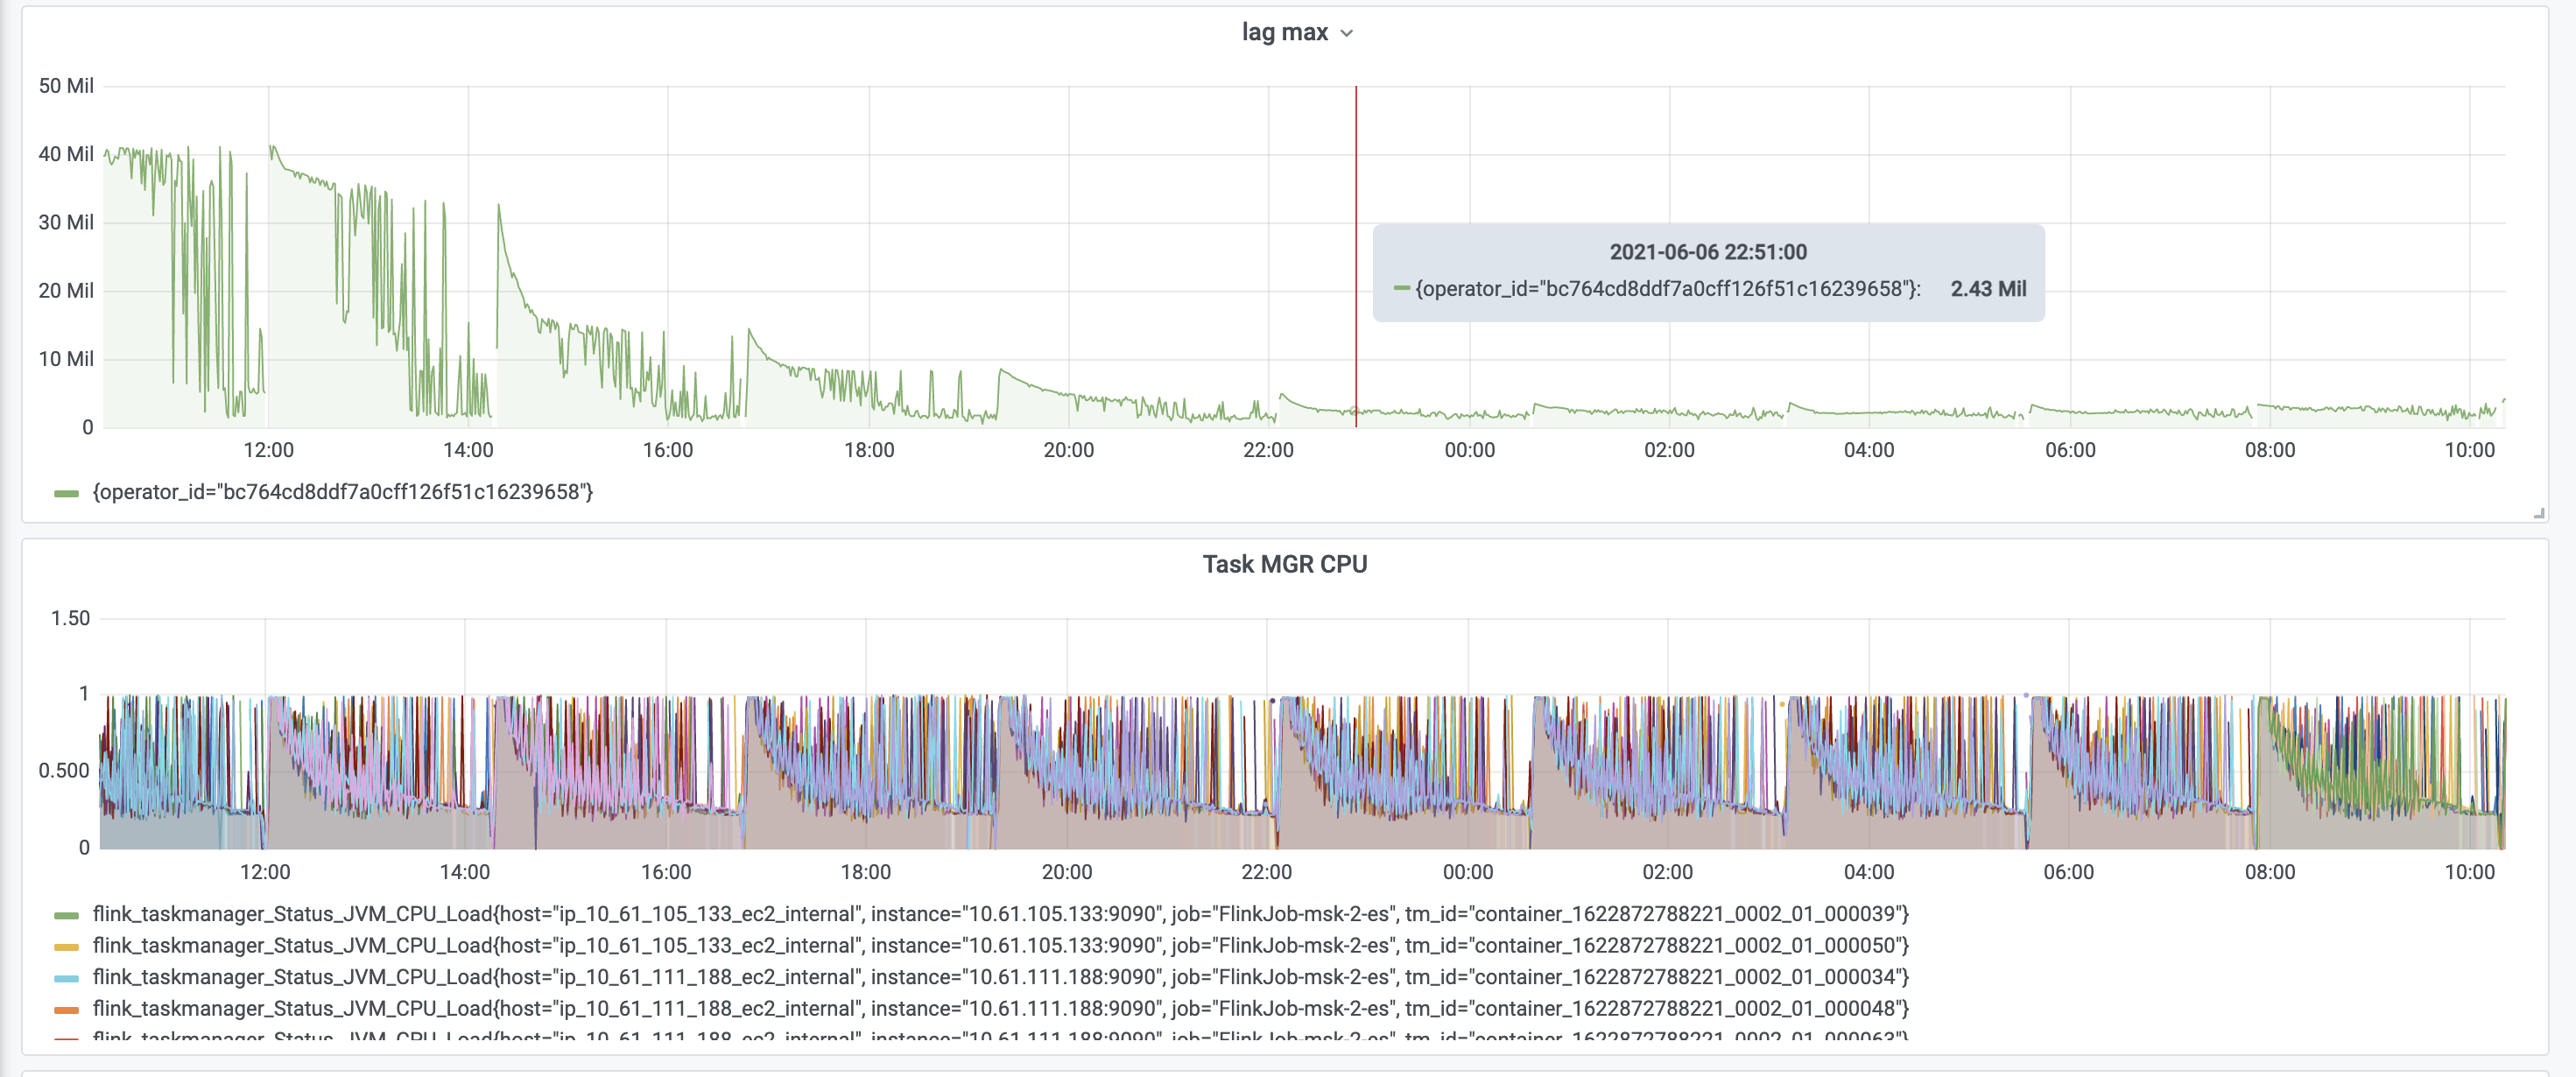
Hi team, We are using Flink to sync data from Kafka to Elasitcsearch and the Kafka is in upsert-mode. We detect some wired patterns as shown in the figure below. 1. Job restarts regularly from the checkpoint for some unknown reasons; 2. For each run, performance and CPU utilization degenerates as time goes on, and restarts till some point; 3. The ES is far from being loaded and the job has the similar behavior even with blackhole sink; We doubt it's due to some unreasonable configuration of the memory, and we do notice some OutOfMemory exceptions in the log. Our host has 61GB memory and the memory configuration is as below: "taskmanager.memory.network.fraction": "0.2", "taskmanager.memory.network.max": "8g", "taskmanager.memory.network.min": "3g", "taskmanager.memory.process.size": "40g" We've another job with a more fierce stream join workload with the same host type and memory configuration, and we do not face such issues. We even also tried enlarging the host type, the issue still exists. We doubt if the memory configuration is reasonable or if there is some memory leak somewhere. Is there any guidance on this?    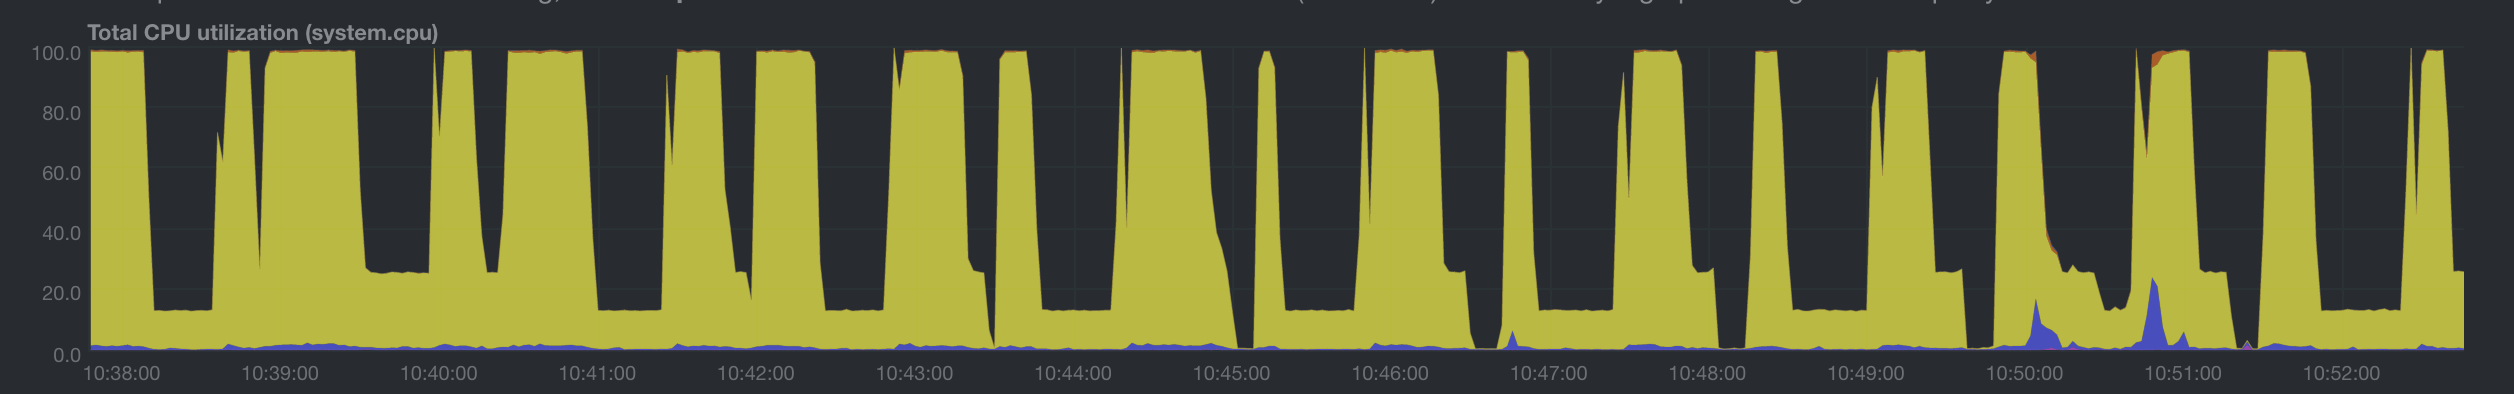 Best wishes, - Kai |
Re: Wired pattern of syncing Kafka to Elasticsearch
|
|
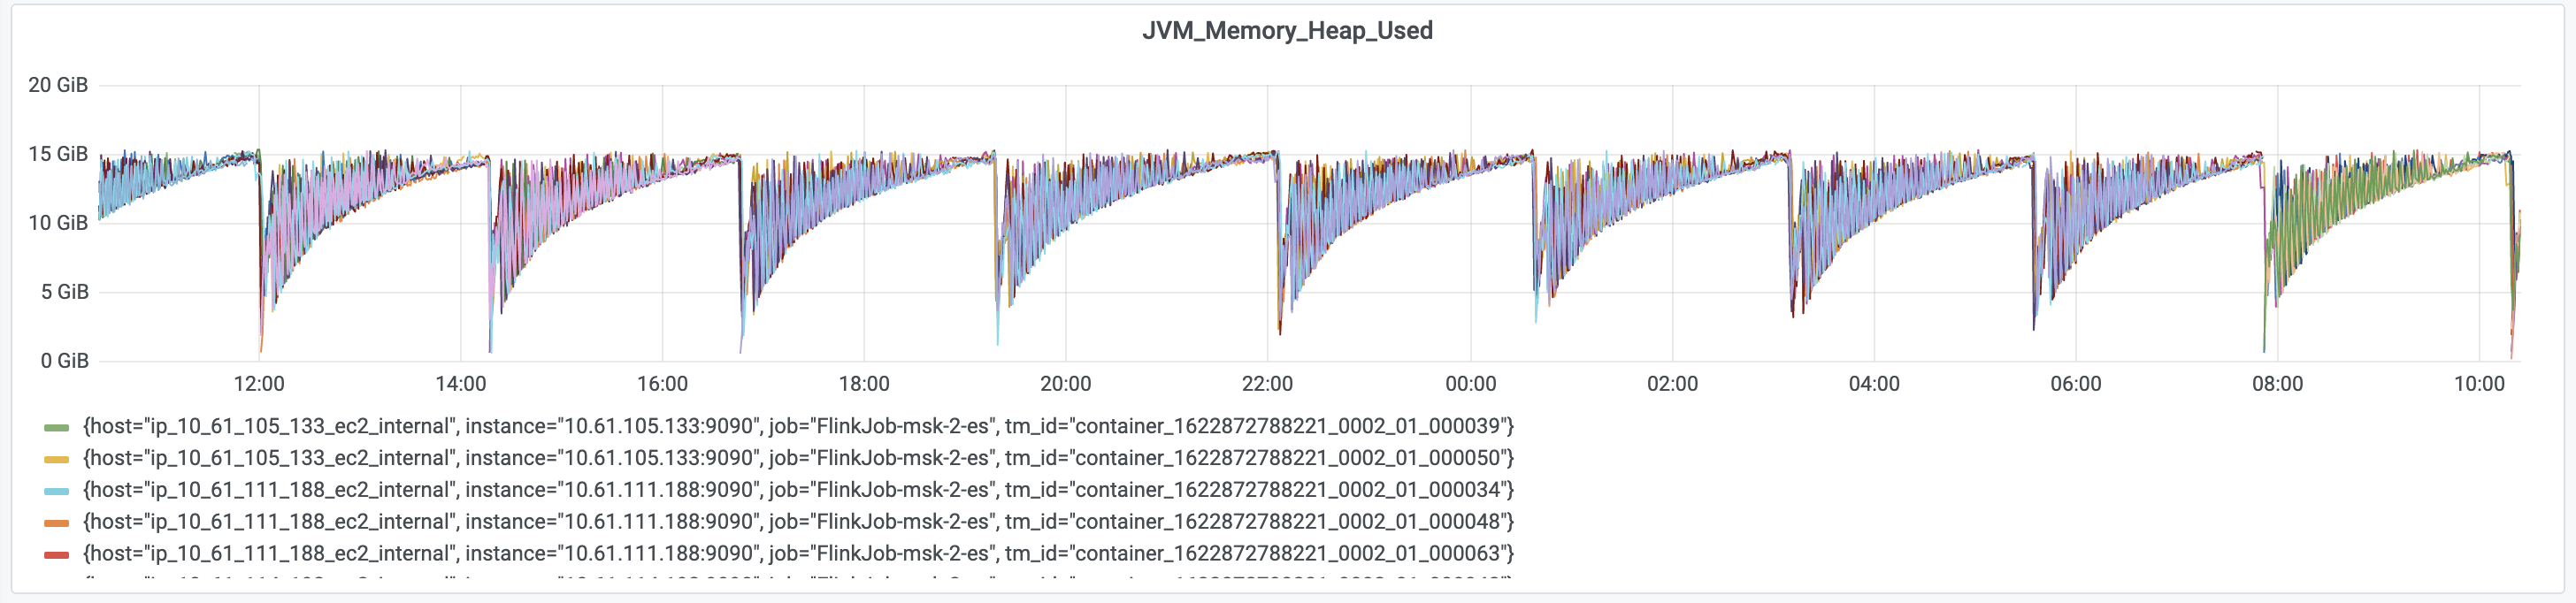
Hi Kai, Do you have jobmanager and taskmanager logs to look at? Interesting moments could be when the job dies and restarts, but also when things start to become very jittery. In the lag max and task manager CPU graphs, it looks like this happens significantly before the job dies. It also looks like the job restored from that point, so probably no later checkpoint succeeded? I assume the frequent spikes in lag are not due to actual new events, but some issue with the job. I assume JVM max heap is around 15GB? Which is the quarter of physical memory mentioned here [1]. It does look like JVM heap is slowly filling up and the job shows weird behavior once used memory crosses ~10GB. Does the job simply persist event data in Elasticsearch or perform other operations before? Best wishes, Nico On Mon, Jun 7, 2021 at 5:01 AM Kai Fu <[hidden email]> wrote:
|


Re: Wired pattern of syncing Kafka to Elasticsearch
|
|
Sorry, the docs link was for 1.9, so that may not be relevant depending on the version you use. On Mon, Jun 7, 2021 at 3:01 PM Nicolaus Weidner <[hidden email]> wrote:
|


|
|
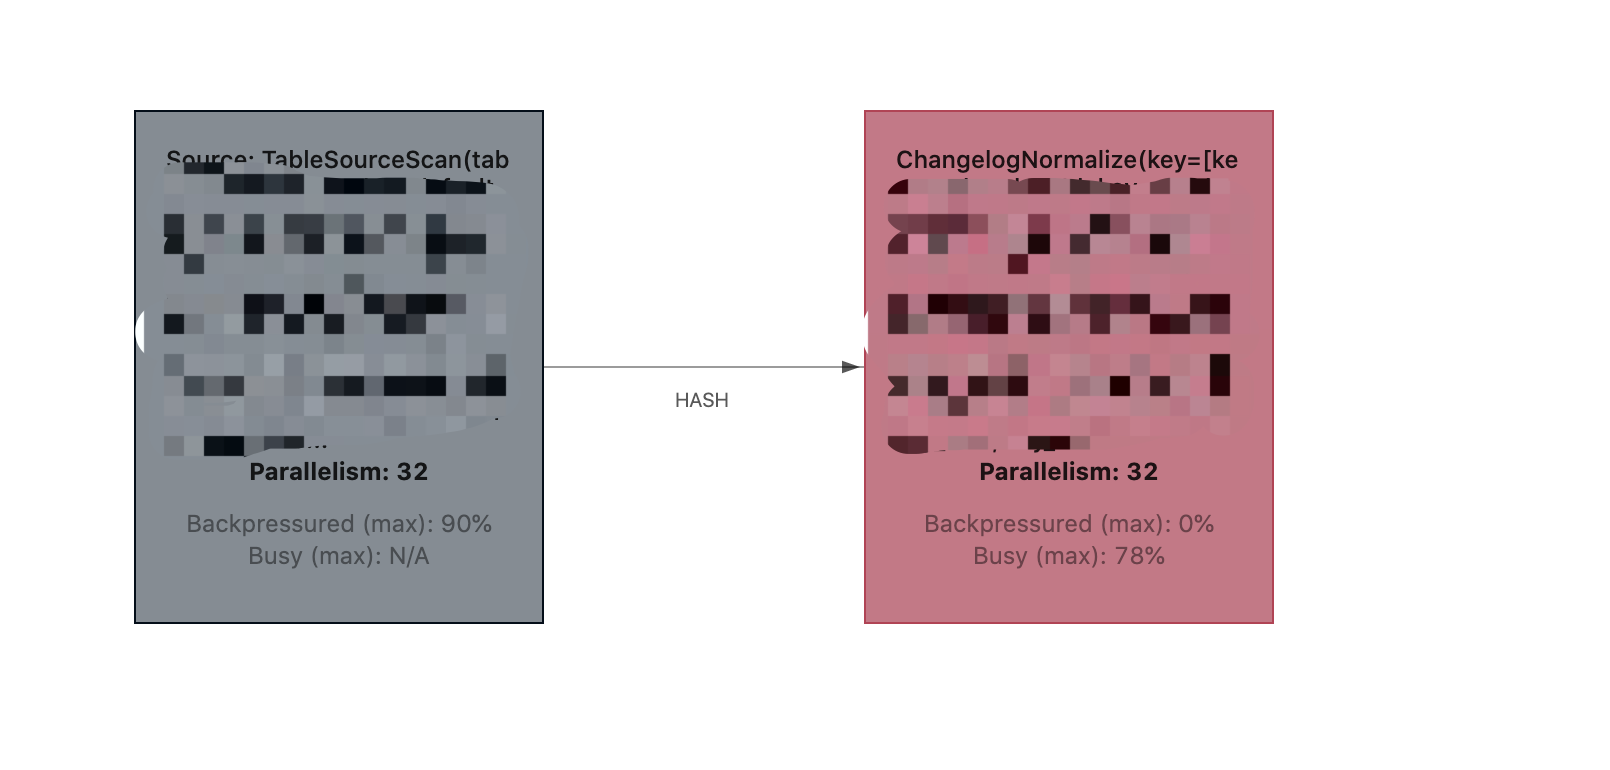
Hi Nicolaus, Thank you for the reply, the job is very simple and it's just reading data from upsert-kafka(2.8.0) and writing to ElasticSearch(7.10) directly. We are using SQL table API of flink 1.13.1. There are some related logs when the job stops and restarts, which is in another thread. The job graph is as below:  On Mon, Jun 7, 2021 at 9:11 PM Nicolaus Weidner <[hidden email]> wrote:
Best wishes, - Kai |


|
|
Hi, We've dumped the GC logs and uploaded them to GcEasy and here is the GC report. A note is that we've the problem even if the sink is Kafka. So I'm doubting the memory settings. On Mon, Jun 7, 2021 at 9:36 PM Kai Fu <[hidden email]> wrote:
Best wishes, - Kai |


|
|
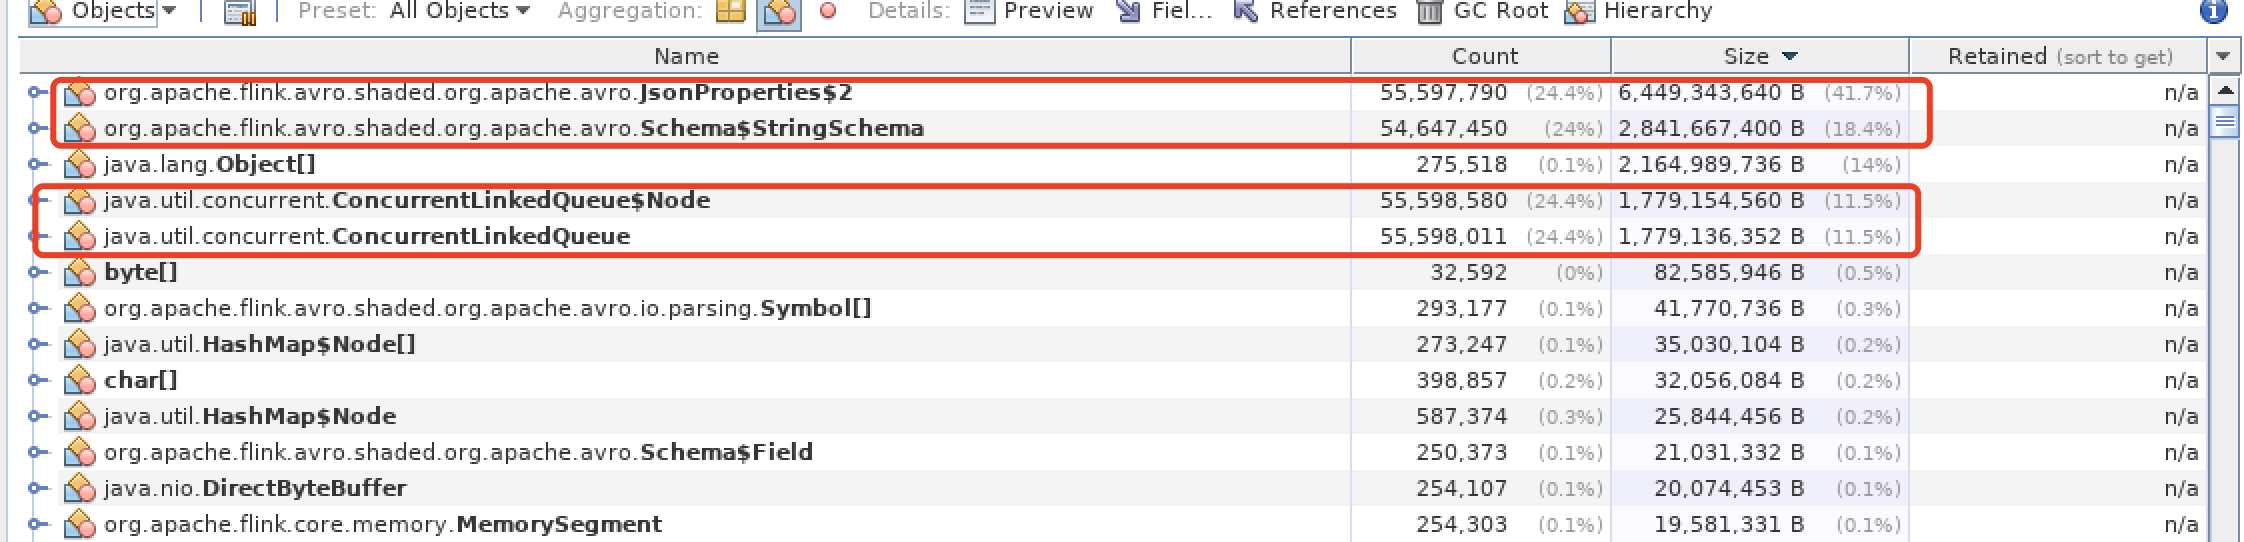
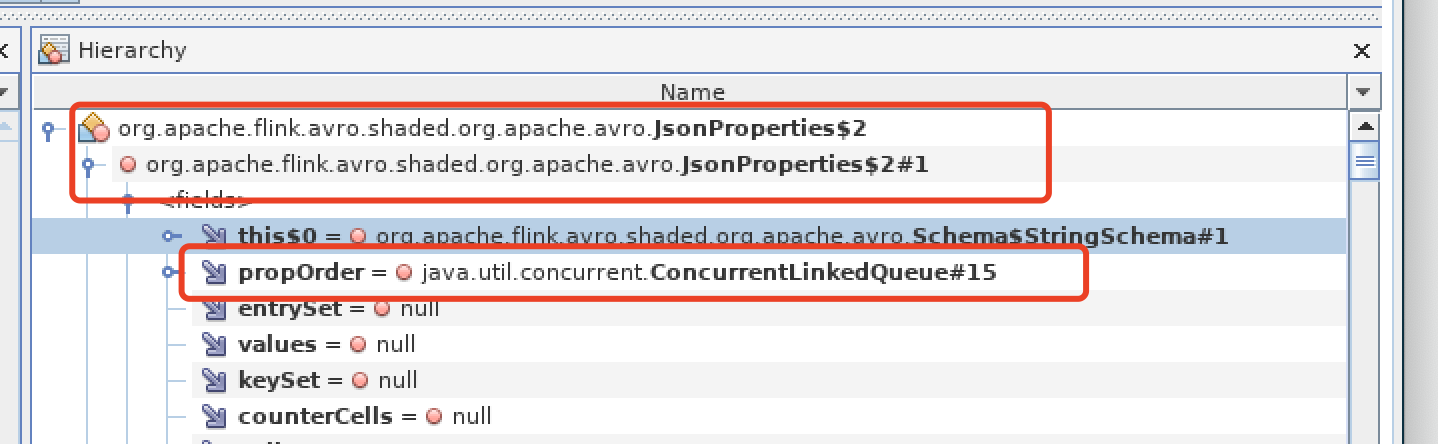
Hi, With a heap dump analysis, it seems the avro library has a memory leak. Has anyone experienced this?   On Tue, Jun 8, 2021 at 12:10 AM Kai Fu <[hidden email]> wrote:
Best wishes, - Kai |


|
|
The memory leak is caused by a bug of avro-schema. https://github.com/confluentinc/schema-registry/issues/285On Tue, Jun 8, 2021 at 9:23 AM Kai Fu <[hidden email]> wrote:
Best wishes, - Kai |


Re: Wired pattern of syncing Kafka to Elasticsearch
|
|
Hi Kai, that's very interesting, thanks for investigating and sharing! Which version of Flink are you running? The bug you posted seems to be fixed in schema registry 5.1.x. If I am not mistaken, since Flink 1.12, version 5.4+ is used, so it should not have the problem anymore. Best wishes, Nico On Tue, Jun 8, 2021 at 10:33 AM Kai Fu <[hidden email]> wrote:
|


|
|
Hi Nicolaus, We're using Flink 1.13.1. The one I posted is the Confluent schema-registry which was facing the similar issue as we have and got fixed. We're using Glue schema registry, and the same pattern happened here, which seems to be in-appropriate using the Avro library in GlueRegistrySchema which was introduced in 1.13. We've a simple fix locally for now with a cache and reaching out to the Glue team and pushing for the fix. On Wed, Jun 9, 2021 at 4:01 PM Nicolaus Weidner <[hidden email]> wrote:
Best wishes, - Kai |


«
Return to (DEPRECATED) Apache Flink User Mailing List archive.
|
1 view|%1 views
| Free forum by Nabble | Edit this page |