Tasks crashing when using Kafka with different paralelism.

classic Classic list List threaded Threaded
4 messages Options
Reply | Threaded
Open this post in threaded view
|

Tasks crashing when using Kafka with different paralelism.

Niels Basjes
Hi,

I'm building a flink streaming application.
My Kafka topic that I use as a source has 20 partitions and 2 replicas.

The code looks roughly like this:

StreamExecutionEnvironment env = StreamExecutionEnvironment.getExecutionEnvironment();
env.getConfig().setAutoWatermarkInterval(1000);// A watermark only every 1 second
env.setStateBackend(new FsStateBackend(config.getString("flink.savepoint.dir", null)));
env.enableCheckpointing(5000, CheckpointingMode.EXACTLY_ONCE);

// !!! VERY IMPORTANT !!!
// We control the time in the events
env.setStreamTimeCharacteristic(TimeCharacteristic.EventTime);

// Get the raw measurements from Kafka
DataStream<Measurement> rawStream = env
  .addSource(new FlinkKafkaConsumer09<>(
             config.getString("kafka.measure_raw.topic"),
             new MeasurementSchema(),
             getKafkaProperties(config)))
// When we have deserialization problems we will have 'null' records in the stream.
.filter(MeasurementFilters.dropNullMeasurements());
After this I do a statefull processing that retains stuff in memory.
The end result is then written back into Kafka.

I start this using this commandline so it runs on my Yarn installation:

flink run -m yarn-cluster --yarnstreaming -yn 20 -ys 4  -yjm 4096 -ytm 8192 ./target/myapp-*.jar

After a minute or two this thing fails completely.


Question 1: What is the best place to look for logs that may contain the reason 'why' it crashed? I have full admin rights on this cluster (All: Linux, Yarn, Kafka, etc), so I can look anywhere.
Till now I have not yet been able to find the reason yet.

I have found in the logs on hdfs this (i.e. the jobmanager reporting that a task died):
2017-01-18 14:34:09,167 INFO  org.apache.flink.yarn.YarnFlinkResourceManager                - Container ResourceID{resourceId='container_1484039552799_0015_01_000008'} failed. Exit status: -100
2017-01-18 14:34:09,168 INFO  org.apache.flink.yarn.YarnFlinkResourceManager                - Diagnostics for container ResourceID{resourceId='container_1484039552799_0015_01_000008'} in state COMPLETE : exitStatus=-100 diagnostics=Container released on a *lost* node
2017-01-18 14:34:09,168 INFO  org.apache.flink.yarn.YarnFlinkResourceManager                - Total number of failed containers so far: 1
2017-01-18 14:34:09,168 INFO  org.apache.flink.yarn.YarnFlinkResourceManager                - Container ResourceID{resourceId='container_1484039552799_0015_01_000020'} failed. Exit status: -100
2017-01-18 14:34:09,168 INFO  org.apache.flink.yarn.YarnFlinkResourceManager                - Diagnostics for container ResourceID{resourceId='container_1484039552799_0015_01_000020'} in state COMPLETE : exitStatus=-100 diagnostics=Container released on a *lost* node
2017-01-18 14:34:09,168 INFO  org.apache.flink.yarn.YarnFlinkResourceManager                - Total number of failed containers so far: 2
2017-01-18 14:34:09,168 INFO  org.apache.flink.yarn.YarnFlinkResourceManager                - Requesting new TaskManager container with 8192 megabytes memory. Pending requests: 1
2017-01-18 14:34:09,168 INFO  org.apache.flink.yarn.YarnFlinkResourceManager                - Requesting new TaskManager container with 8192 megabytes memory. Pending requests: 2


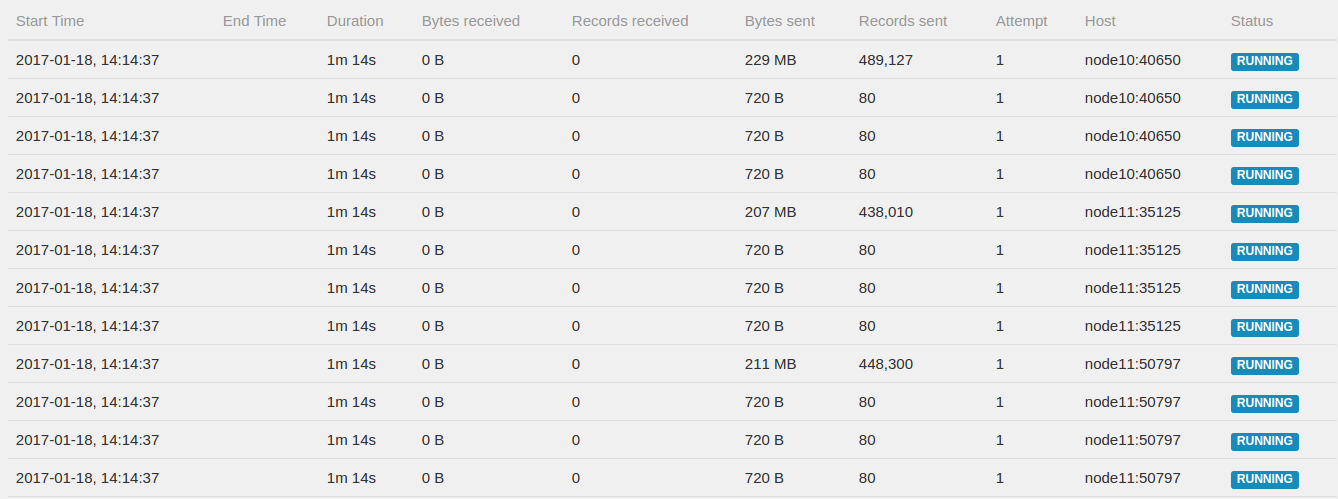
What I noticed is that in the webUI I see this (screenshot below).
Apparently the system created 80 tasks to read from Kafka where only 20 partitions exist. 
So 3 out of 4 task are completely idle, perhaps the cause of these problems is a timeout on the connection to Kafka?
When I force the Kafka consumer to have 10 instances by adding .setParallelism(10) it runs for hours.


What I expected is that the Kafka consumer would always FORCE the consumer tasks to be the same as the Kafka partitions.
Question 2: Why is this not the case?


Inline image 1


--
Best regards / Met vriendelijke groeten,

Niels Basjes
Reply | Threaded
Open this post in threaded view
|

Re: Tasks crashing when using Kafka with different paralelism.

Fabian Hueske-2
Hi Niels,

I think Robert (in CC) might be able to help you.

Best, Fabian

2017-01-18 16:38 GMT+01:00 Niels Basjes <[hidden email]>:
Hi,

I'm building a flink streaming application.
My Kafka topic that I use as a source has 20 partitions and 2 replicas.

The code looks roughly like this:

StreamExecutionEnvironment env = StreamExecutionEnvironment.getExecutionEnvironment();
env.getConfig().setAutoWatermarkInterval(1000);// A watermark only every 1 second
env.setStateBackend(new FsStateBackend(config.getString("flink.savepoint.dir", null)));
env.enableCheckpointing(5000, CheckpointingMode.EXACTLY_ONCE);

// !!! VERY IMPORTANT !!!
// We control the time in the events
env.setStreamTimeCharacteristic(TimeCharacteristic.EventTime);

// Get the raw measurements from Kafka
DataStream<Measurement> rawStream = env
  .addSource(new FlinkKafkaConsumer09<>(
             config.getString("kafka.measure_raw.topic"),
             new MeasurementSchema(),
             getKafkaProperties(config)))
// When we have deserialization problems we will have 'null' records in the stream.
.filter(MeasurementFilters.dropNullMeasurements());
After this I do a statefull processing that retains stuff in memory.
The end result is then written back into Kafka.

I start this using this commandline so it runs on my Yarn installation:

flink run -m yarn-cluster --yarnstreaming -yn 20 -ys 4  -yjm 4096 -ytm 8192 ./target/myapp-*.jar

After a minute or two this thing fails completely.


Question 1: What is the best place to look for logs that may contain the reason 'why' it crashed? I have full admin rights on this cluster (All: Linux, Yarn, Kafka, etc), so I can look anywhere.
Till now I have not yet been able to find the reason yet.

I have found in the logs on hdfs this (i.e. the jobmanager reporting that a task died):
2017-01-18 14:34:09,167 INFO  org.apache.flink.yarn.YarnFlinkResourceManager                - Container ResourceID{resourceId='container_1484039552799_0015_01_000008'} failed. Exit status: -100
2017-01-18 14:34:09,168 INFO  org.apache.flink.yarn.YarnFlinkResourceManager                - Diagnostics for container ResourceID{resourceId='container_1484039552799_0015_01_000008'} in state COMPLETE : exitStatus=-100 diagnostics=Container released on a *lost* node
2017-01-18 14:34:09,168 INFO  org.apache.flink.yarn.YarnFlinkResourceManager                - Total number of failed containers so far: 1
2017-01-18 14:34:09,168 INFO  org.apache.flink.yarn.YarnFlinkResourceManager                - Container ResourceID{resourceId='container_1484039552799_0015_01_000020'} failed. Exit status: -100
2017-01-18 14:34:09,168 INFO  org.apache.flink.yarn.YarnFlinkResourceManager                - Diagnostics for container ResourceID{resourceId='container_1484039552799_0015_01_000020'} in state COMPLETE : exitStatus=-100 diagnostics=Container released on a *lost* node
2017-01-18 14:34:09,168 INFO  org.apache.flink.yarn.YarnFlinkResourceManager                - Total number of failed containers so far: 2
2017-01-18 14:34:09,168 INFO  org.apache.flink.yarn.YarnFlinkResourceManager                - Requesting new TaskManager container with 8192 megabytes memory. Pending requests: 1
2017-01-18 14:34:09,168 INFO  org.apache.flink.yarn.YarnFlinkResourceManager                - Requesting new TaskManager container with 8192 megabytes memory. Pending requests: 2


What I noticed is that in the webUI I see this (screenshot below).
Apparently the system created 80 tasks to read from Kafka where only 20 partitions exist. 
So 3 out of 4 task are completely idle, perhaps the cause of these problems is a timeout on the connection to Kafka?
When I force the Kafka consumer to have 10 instances by adding .setParallelism(10) it runs for hours.


What I expected is that the Kafka consumer would always FORCE the consumer tasks to be the same as the Kafka partitions.
Question 2: Why is this not the case?


Inline image 1


--
Best regards / Met vriendelijke groeten,

Niels Basjes

Reply | Threaded
Open this post in threaded view
|

Re: Tasks crashing when using Kafka with different paralelism.

Stephan Ewen
Hi Niels!

Quick answers to your questions:

(1) Where to look for exceptions: The WebUI is the easiest place, it should have the exceptions that occurred. The JobManager logs also why a jobs crash

(2) We do not strictly assume that the number of partitions is static (the next version of the Kafka consumer should for example have dynamic partition and topic discovery). That's why it is possible that some sources idle. They should exclude themselves from affecting event time, so it should not affect the application (only have an idle task sitting around)

Would be good to know what is the ultimate reason for the failure.

Stephan


On Wed, Jan 18, 2017 at 5:32 PM, Fabian Hueske <[hidden email]> wrote:
Hi Niels,

I think Robert (in CC) might be able to help you.

Best, Fabian

2017-01-18 16:38 GMT+01:00 Niels Basjes <[hidden email]>:
Hi,

I'm building a flink streaming application.
My Kafka topic that I use as a source has 20 partitions and 2 replicas.

The code looks roughly like this:

StreamExecutionEnvironment env = StreamExecutionEnvironment.getExecutionEnvironment();
env.getConfig().setAutoWatermarkInterval(1000);// A watermark only every 1 second
env.setStateBackend(new FsStateBackend(config.getString("flink.savepoint.dir", null)));
env.enableCheckpointing(5000, CheckpointingMode.EXACTLY_ONCE);

// !!! VERY IMPORTANT !!!
// We control the time in the events
env.setStreamTimeCharacteristic(TimeCharacteristic.EventTime);

// Get the raw measurements from Kafka
DataStream<Measurement> rawStream = env
  .addSource(new FlinkKafkaConsumer09<>(
             config.getString("kafka.measure_raw.topic"),
             new MeasurementSchema(),
             getKafkaProperties(config)))
// When we have deserialization problems we will have 'null' records in the stream.
.filter(MeasurementFilters.dropNullMeasurements());
After this I do a statefull processing that retains stuff in memory.
The end result is then written back into Kafka.

I start this using this commandline so it runs on my Yarn installation:

flink run -m yarn-cluster --yarnstreaming -yn 20 -ys 4  -yjm 4096 -ytm 8192 ./target/myapp-*.jar

After a minute or two this thing fails completely.


Question 1: What is the best place to look for logs that may contain the reason 'why' it crashed? I have full admin rights on this cluster (All: Linux, Yarn, Kafka, etc), so I can look anywhere.
Till now I have not yet been able to find the reason yet.

I have found in the logs on hdfs this (i.e. the jobmanager reporting that a task died):
2017-01-18 14:34:09,167 INFO  org.apache.flink.yarn.YarnFlinkResourceManager                - Container ResourceID{resourceId='container_1484039552799_0015_01_000008'} failed. Exit status: -100
2017-01-18 14:34:09,168 INFO  org.apache.flink.yarn.YarnFlinkResourceManager                - Diagnostics for container ResourceID{resourceId='container_1484039552799_0015_01_000008'} in state COMPLETE : exitStatus=-100 diagnostics=Container released on a *lost* node
2017-01-18 14:34:09,168 INFO  org.apache.flink.yarn.YarnFlinkResourceManager                - Total number of failed containers so far: 1
2017-01-18 14:34:09,168 INFO  org.apache.flink.yarn.YarnFlinkResourceManager                - Container ResourceID{resourceId='container_1484039552799_0015_01_000020'} failed. Exit status: -100
2017-01-18 14:34:09,168 INFO  org.apache.flink.yarn.YarnFlinkResourceManager                - Diagnostics for container ResourceID{resourceId='container_1484039552799_0015_01_000020'} in state COMPLETE : exitStatus=-100 diagnostics=Container released on a *lost* node
2017-01-18 14:34:09,168 INFO  org.apache.flink.yarn.YarnFlinkResourceManager                - Total number of failed containers so far: 2
2017-01-18 14:34:09,168 INFO  org.apache.flink.yarn.YarnFlinkResourceManager                - Requesting new TaskManager container with 8192 megabytes memory. Pending requests: 1
2017-01-18 14:34:09,168 INFO  org.apache.flink.yarn.YarnFlinkResourceManager                - Requesting new TaskManager container with 8192 megabytes memory. Pending requests: 2


What I noticed is that in the webUI I see this (screenshot below).
Apparently the system created 80 tasks to read from Kafka where only 20 partitions exist. 
So 3 out of 4 task are completely idle, perhaps the cause of these problems is a timeout on the connection to Kafka?
When I force the Kafka consumer to have 10 instances by adding .setParallelism(10) it runs for hours.


What I expected is that the Kafka consumer would always FORCE the consumer tasks to be the same as the Kafka partitions.
Question 2: Why is this not the case?


Inline image 1


--
Best regards / Met vriendelijke groeten,

Niels Basjes


Reply | Threaded
Open this post in threaded view
|

Re: Tasks crashing when using Kafka with different paralelism.

rmetzger0
Sorry for not responding earlier to this.

For Q1, I do the following: I stop the entire yarn application and download the aggregated YARN logs. There, you'll find a section for each container. I'm pretty sure you'll find either that those container JVMs died with an exception (like OOM) or they were killed with SIGTERM (Flink is logging when its receiving that signal). If its a SIGTERM, its either the linux OOM killer or YARNs NodeManager. If its the NodeManager, you'll see that in the JobManager log (because YARN says its killing the container).


On Tue, Jan 24, 2017 at 3:22 PM, Stephan Ewen <[hidden email]> wrote:
Hi Niels!

Quick answers to your questions:

(1) Where to look for exceptions: The WebUI is the easiest place, it should have the exceptions that occurred. The JobManager logs also why a jobs crash

(2) We do not strictly assume that the number of partitions is static (the next version of the Kafka consumer should for example have dynamic partition and topic discovery). That's why it is possible that some sources idle. They should exclude themselves from affecting event time, so it should not affect the application (only have an idle task sitting around)

Would be good to know what is the ultimate reason for the failure.

Stephan


On Wed, Jan 18, 2017 at 5:32 PM, Fabian Hueske <[hidden email]> wrote:
Hi Niels,

I think Robert (in CC) might be able to help you.

Best, Fabian

2017-01-18 16:38 GMT+01:00 Niels Basjes <[hidden email]>:
Hi,

I'm building a flink streaming application.
My Kafka topic that I use as a source has 20 partitions and 2 replicas.

The code looks roughly like this:

StreamExecutionEnvironment env = StreamExecutionEnvironment.getExecutionEnvironment();
env.getConfig().setAutoWatermarkInterval(1000);// A watermark only every 1 second
env.setStateBackend(new FsStateBackend(config.getString("flink.savepoint.dir", null)));
env.enableCheckpointing(5000, CheckpointingMode.EXACTLY_ONCE);

// !!! VERY IMPORTANT !!!
// We control the time in the events
env.setStreamTimeCharacteristic(TimeCharacteristic.EventTime);

// Get the raw measurements from Kafka
DataStream<Measurement> rawStream = env
  .addSource(new FlinkKafkaConsumer09<>(
             config.getString("kafka.measure_raw.topic"),
             new MeasurementSchema(),
             getKafkaProperties(config)))
// When we have deserialization problems we will have 'null' records in the stream.
.filter(MeasurementFilters.dropNullMeasurements());
After this I do a statefull processing that retains stuff in memory.
The end result is then written back into Kafka.

I start this using this commandline so it runs on my Yarn installation:

flink run -m yarn-cluster --yarnstreaming -yn 20 -ys 4  -yjm 4096 -ytm 8192 ./target/myapp-*.jar

After a minute or two this thing fails completely.


Question 1: What is the best place to look for logs that may contain the reason 'why' it crashed? I have full admin rights on this cluster (All: Linux, Yarn, Kafka, etc), so I can look anywhere.
Till now I have not yet been able to find the reason yet.

I have found in the logs on hdfs this (i.e. the jobmanager reporting that a task died):
2017-01-18 14:34:09,167 INFO  org.apache.flink.yarn.YarnFlinkResourceManager                - Container ResourceID{resourceId='container_1484039552799_0015_01_000008'} failed. Exit status: -100
2017-01-18 14:34:09,168 INFO  org.apache.flink.yarn.YarnFlinkResourceManager                - Diagnostics for container ResourceID{resourceId='container_1484039552799_0015_01_000008'} in state COMPLETE : exitStatus=-100 diagnostics=Container released on a *lost* node
2017-01-18 14:34:09,168 INFO  org.apache.flink.yarn.YarnFlinkResourceManager                - Total number of failed containers so far: 1
2017-01-18 14:34:09,168 INFO  org.apache.flink.yarn.YarnFlinkResourceManager                - Container ResourceID{resourceId='container_1484039552799_0015_01_000020'} failed. Exit status: -100
2017-01-18 14:34:09,168 INFO  org.apache.flink.yarn.YarnFlinkResourceManager                - Diagnostics for container ResourceID{resourceId='container_1484039552799_0015_01_000020'} in state COMPLETE : exitStatus=-100 diagnostics=Container released on a *lost* node
2017-01-18 14:34:09,168 INFO  org.apache.flink.yarn.YarnFlinkResourceManager                - Total number of failed containers so far: 2
2017-01-18 14:34:09,168 INFO  org.apache.flink.yarn.YarnFlinkResourceManager                - Requesting new TaskManager container with 8192 megabytes memory. Pending requests: 1
2017-01-18 14:34:09,168 INFO  org.apache.flink.yarn.YarnFlinkResourceManager                - Requesting new TaskManager container with 8192 megabytes memory. Pending requests: 2


What I noticed is that in the webUI I see this (screenshot below).
Apparently the system created 80 tasks to read from Kafka where only 20 partitions exist. 
So 3 out of 4 task are completely idle, perhaps the cause of these problems is a timeout on the connection to Kafka?
When I force the Kafka consumer to have 10 instances by adding .setParallelism(10) it runs for hours.


What I expected is that the Kafka consumer would always FORCE the consumer tasks to be the same as the Kafka partitions.
Question 2: Why is this not the case?


Inline image 1


--
Best regards / Met vriendelijke groeten,

Niels Basjes