Task Manager Killed by OOM


|
Hi all,
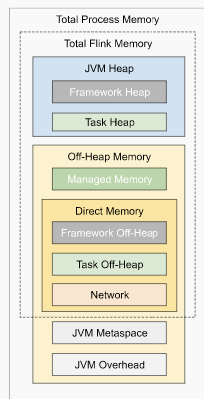
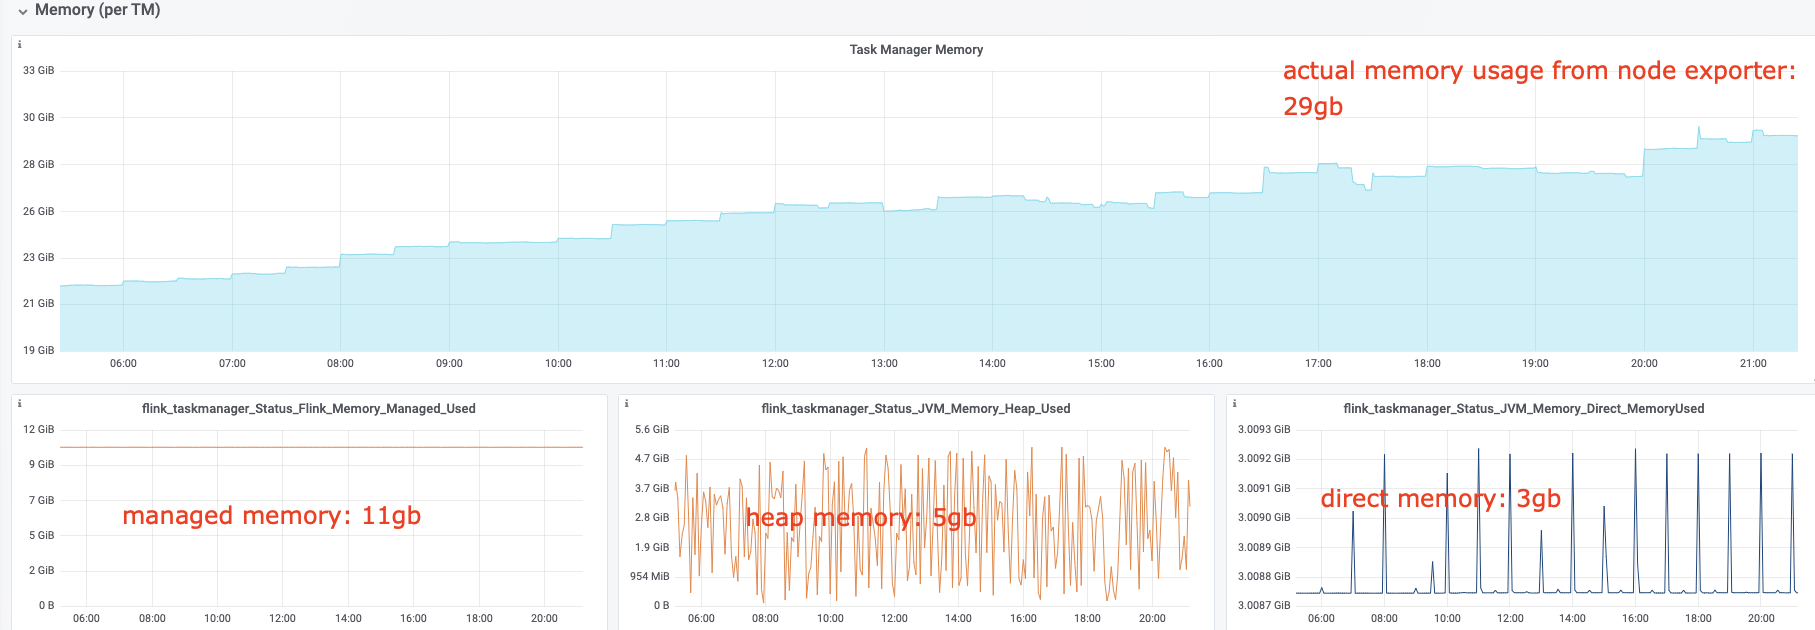
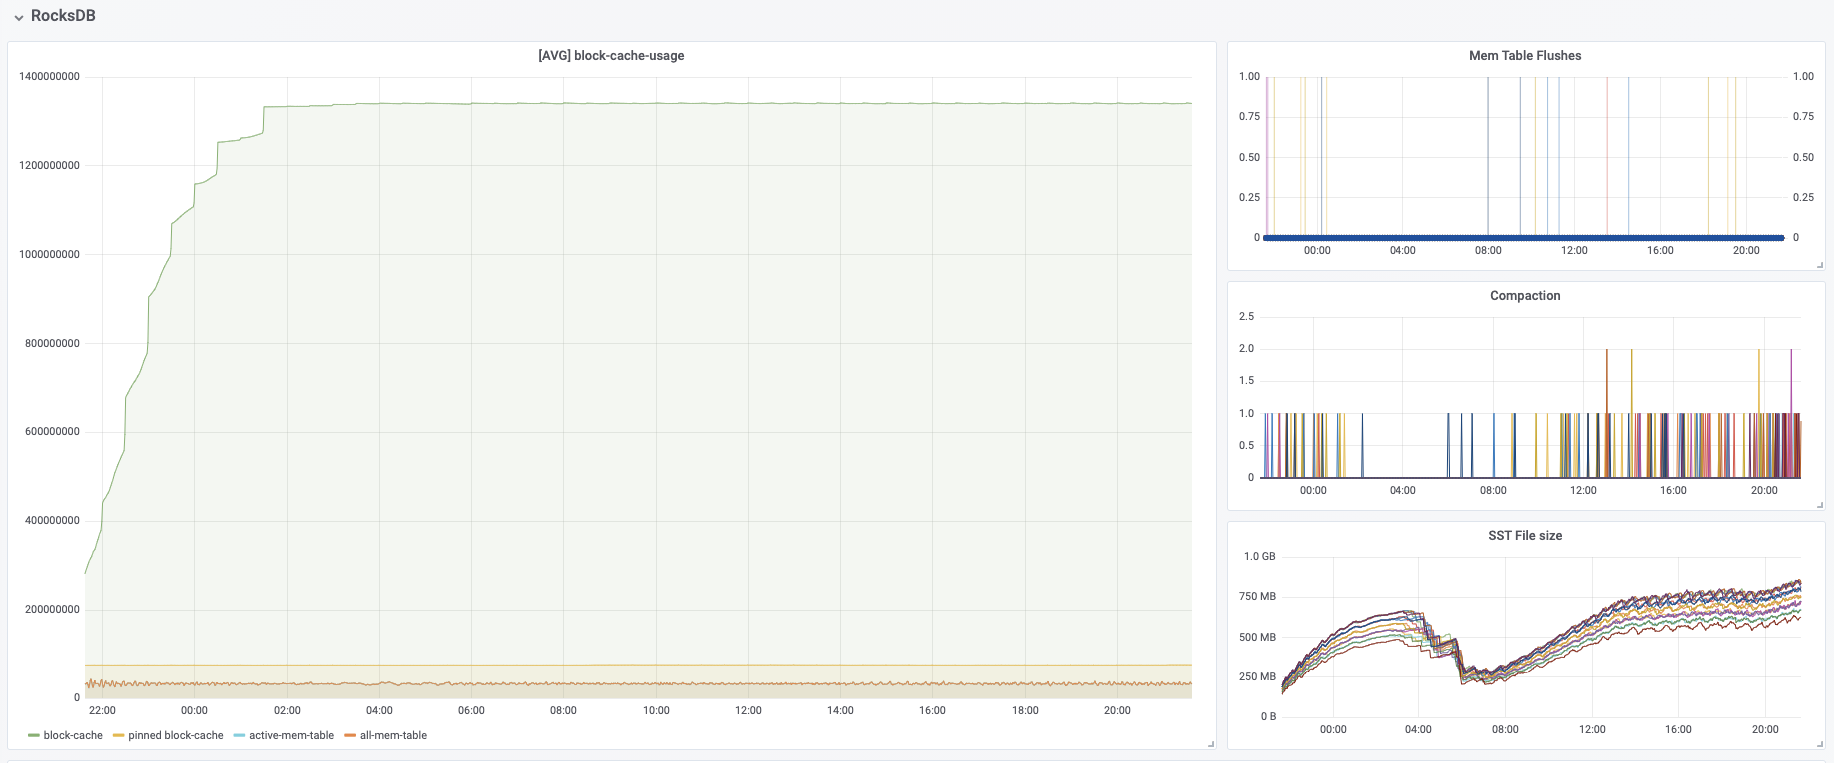
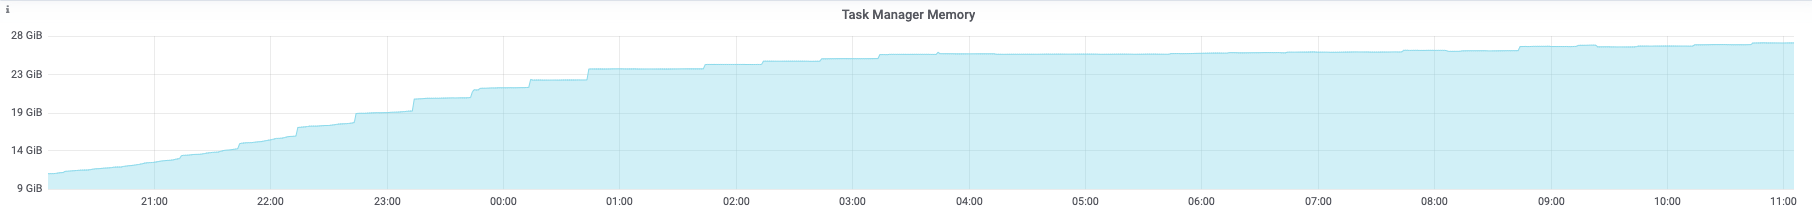
I have some questions regarding the task manager memory usage. Currently, I have a cluster with 20 task managers. After our application runs for several hours, the system kills the task manager process due to OOM. This is the kernel log when that happens: [Fri Jun 4 06:49:02 2021] Out of memory: Kill process 16019 (java) score 932 or sacrifice child [Fri Jun 4 06:49:02 2021] Killed process 16019 (java) total-vm:45951304kB, anon-rss:31668488kB, file-rss:0kB [Mon Jun 7 08:50:38 2021] nr_pdflush_threads exported in /proc is scheduled for removal However, the memory usage from the machine metrics shows the flink process exceeds 29gb and then eventually killed due to OOM.  I was referring to this chart that shows how memory is divided in flink task manager:  But it seems in my case, heap(5gb) + managed(11gb) + direct memory(3gb) << actual memory usage(29gb) Can someone help explain where I missed? Also, one thing I suspected is that rocksdb didn't flush the keyed state properly, or fast enough. But from what I can see, it seems rocksdb was doing its job alright:  And there was no rocksdb delayed write rate or background error. Also, I think the memory usage for rocksdb should be included in managed memory already. So, I concluded rocksdb was not the problem. But I might be wrong, so, let me share it here. Best regards Mu |
|
|
Thanks for offering help. I'm using flink 1.12.3 Allow me to share the flink-conf on jm and tm.On job manager env.java.home: ------------------ env.java.opts: "-Djava.security.krb5.conf=-------------------/krb5.conf -Djava.security.auth.login.config=------------------/kafka_client_jaas.conf" cluster.evenly-spread-out-slots: true jobmanager.memory.flink.size: 16384m jobmanager.web.address: 0.0.0.0 jobmanager.web.port: 8081 jobmanager.web.submit.enable: true jobmanager.rpc.address: -------------------------- jobmanager.rpc.port: 6123 task.cancellation.interval: 60000 task.cancellation.timeout: 0 taskmanager.memory.flink.size: 30720m # Special config for realtime metrics # task manager memory tuning taskmanager.memory.jvm-metaspace.size: 1024mb taskmanager.heap.size: 24g taskmanager.managed.memory.fraction: 0.4 #taskmanager.network.memory.fraction: 0.4 taskmanager.network.memory.max: 4g taskmanager.network.memory.min: 1g # rocksdb monitoring state.backend.rocksdb.metrics.estimate-num-keys: true state.backend.rocksdb.metrics.num-running-compactions: true state.backend.rocksdb.metrics.background-errors: true state.backend.rocksdb.metrics.block-cache-capacity: true state.backend.rocksdb.metrics.block-cache-pinned-usage: true state.backend.rocksdb.metrics.block-cache-usage: true state.backend.rocksdb.metrics.compaction-pending: true state.backend.rocksdb.metrics.actual-delayed-write-rate: true state.backend.rocksdb.metrics.background-errors: true state.backend.rocksdb.metrics.column-family-as-variable: true state.backend.rocksdb.metrics.cur-size-active-mem-table: true state.backend.rocksdb.metrics.cur-size-all-mem-tables: true state.backend.rocksdb.metrics.estimate-live-data-size: true state.backend.rocksdb.metrics.is-write-stopped: true state.backend.rocksdb.metrics.num-deletes-active-mem-table: true state.backend.rocksdb.metrics.num-entries-active-mem-table: true state.backend.rocksdb.metrics.num-entries-imm-mem-tables: true state.backend.rocksdb.metrics.num-immutable-mem-table: true state.backend.rocksdb.metrics.num-running-flushes: true state.backend.rocksdb.metrics.size-all-mem-tables: true # rocksdb tuning state.backend.rocksdb.checkpoint.transfer.thread.num: 8 state.backend.rocksdb.thread.num: 8 On Task Manager env.java.home: --------------- env.java.opts: "-Djava.security.krb5.conf=------------------/krb5.conf -Djava.security.auth.login.config=------------------/kafka_client_jaas.conf" cluster.evenly-spread-out-slots: true jobmanager.memory.flink.size: 16384m jobmanager.web.address: 0.0.0.0 jobmanager.web.port: 8081 jobmanager.web.submit.enable: true jobmanager.rpc.address: ------------------------ jobmanager.rpc.port: 6123 task.cancellation.interval: 60000 task.cancellation.timeout: 0 taskmanager.memory.flink.size: 30720m # Special config for realtime metrics # task manager memory tuning taskmanager.memory.jvm-metaspace.size: 1024mb taskmanager.heap.size: 24g taskmanager.managed.memory.fraction: 0.4 #taskmanager.network.memory.fraction: 0.4 taskmanager.network.memory.max: 4g taskmanager.network.memory.min: 1g # rocksdb monitoring state.backend.rocksdb.metrics.estimate-num-keys: true state.backend.rocksdb.metrics.num-running-compactions: true state.backend.rocksdb.metrics.background-errors: true state.backend.rocksdb.metrics.block-cache-capacity: true state.backend.rocksdb.metrics.block-cache-pinned-usage: true state.backend.rocksdb.metrics.block-cache-usage: true state.backend.rocksdb.metrics.compaction-pending: true state.backend.rocksdb.metrics.actual-delayed-write-rate: true state.backend.rocksdb.metrics.background-errors: true state.backend.rocksdb.metrics.column-family-as-variable: true state.backend.rocksdb.metrics.cur-size-active-mem-table: true state.backend.rocksdb.metrics.cur-size-all-mem-tables: true state.backend.rocksdb.metrics.estimate-live-data-size: true state.backend.rocksdb.metrics.is-write-stopped: true state.backend.rocksdb.metrics.num-deletes-active-mem-table: true state.backend.rocksdb.metrics.num-entries-active-mem-table: true state.backend.rocksdb.metrics.num-entries-imm-mem-tables: true state.backend.rocksdb.metrics.num-immutable-mem-table: true state.backend.rocksdb.metrics.num-running-flushes: true state.backend.rocksdb.metrics.mem-table-flush-pending: true state.backend.rocksdb.metrics.size-all-mem-tables: true state.backend.rocksdb.metrics.estimate-table-readers-mem: true state.backend.rocksdb.metrics.total-sst-files-size: true # rocksdb tuning state.backend.rocksdb.checkpoint.transfer.thread.num: 8 state.backend.rocksdb.thread.num: 8 Best regards, Mu On Wed, Jun 9, 2021, 9:47 PM Oran Shuster <[hidden email]> wrote:
|


|
|
Flink's metrics do not cover all memory usages. To be specific, un-managed native memory, which can be allocated by any user code / 3rd-party dependencies, is not monitored. Based on the observation that the machine monitored memory usage keeps growing gradually, there's most likely native memory leaks. I would suggest trying to look for the memory leaks by enabling NMT [1] to track all native memory allocations and deallocations. Thank you~ Xintong Song On Wed, Jun 9, 2021 at 9:42 PM Mu Kong <[hidden email]> wrote:
|


|
|
We had encountered OOM in Flink 1.11.1
Try these steps and provide us with the output.

From: Xintong Song <[hidden email]>
Sent: Thursday, June 10, 2021 6:14 AM To: user <[hidden email]> Subject: Re: Task Manager Killed by OOM
Flink's metrics do not cover all memory usages. To be specific, un-managed native memory, which can be allocated by any user code / 3rd-party dependencies, is not monitored. Based on the observation that the machine monitored memory usage keeps growing gradually,
there's most likely native memory leaks. I would suggest trying to look for the memory leaks by enabling NMT [1] to track all native memory allocations and deallocations.
Thank you~ Xintong Song On Wed, Jun 9, 2021 at 9:42 PM Mu Kong <[hidden email]> wrote:
|


|
|
Hi Mu, with the configuration you provided you set the limit of the overall process to 32 GB (given that you give Flink 30720 MB of memory). Hence, you should check that your system can give at least 32 GB of memory. The exact memory budgets are: frameworkHeapSize=128.000mb (134217728 bytes), frameworkOffHeapSize=128.000mb (134217728 bytes), taskHeapSize=14.750gb (15837691664 bytes), taskOffHeapSize=0 bytes, networkMemSize=3.000gb (3221225520 bytes), managedMemorySize=12.000gb (12884902080 bytes), jvmMetaspaceSize=1024.000mb (1073741824 bytes), jvmOverheadSize=1024.000mb (1073741824 bytes) Please also note that Flink cannot fully control RocksDBs memory consumption yet. See FLINK-15532 for more information. So it could be the case that RocksDB uses more than its assigned budget. And as Xintong mentioned, there could also be a memory leak introduced by the user code (e.g. using some library). Cheers, Till On Thu, Jun 10, 2021 at 7:20 AM Tamir Sagi <[hidden email]> wrote:
|


|
|
Hi all, Thanks a lot for offering help. Sorry that I didn't provide enough information. The cluster is a standalone one with 32gb memory. Tamir's link definitely rings a bell, because we are also heavily using a customized RichMapFunction with a ValueState[T], which seems similar to the issue in the link. Following all the kind suggestions above, right now, I enabled nmt on task manager, and ran GC.class_histogram periodically. Let me share more information after more information is gathered. Best regards, Mu On Thu, Jun 10, 2021 at 6:23 PM Till Rohrmann <[hidden email]> wrote:
|


|
|
Hi all, Thanks for the suggestions. I have been keeping the job running for several hours. And the memory usage from monitoring is increasing. node_memory_MemTotal_bytes  node_memory_Cached_bytes 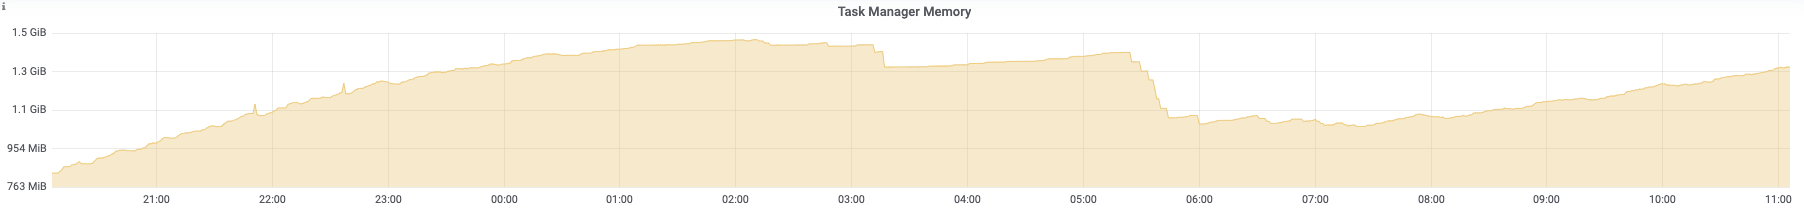 And here is the summary.diff from the nmt: native_mem.diff.2021-06-16, where I failed to find anything suspicious though. Also, following the same procedure in the maillist above, I also did GC.class_histogram, one taken right after I ran the job, one taken after the job ran for 12 hours. But, the count of instances does not seem to change too much. Also, I found something interesting, which is inspired by the maillist shared by Tamir above. In our flink application, one step is using the RichMapFunction after the keyBy, where I use the ValueState. The parameter for keyBy(the key) is actually the userid, while we have more than 100 millions users. When I removed this step, meaning with keyBy but no RichMapFunction, the memory became very stable. So, I wonder if this keyBy(userid) + ValueState combo caused the memory leak, because there will always be new keys getting into the stream. Maybe the state in the RichMapFunction of that key won't really be cleared by TTL? Any ideas? On Thu, Jun 10, 2021 at 10:03 PM Mu Kong <[hidden email]> wrote:
|


|
|
Hi, if your machine running your TaskManager has only 32gb memory available, and you are configuring Flink to use 30gb of memory, it's quite likely in my experience that you'll run into the oom killer. I would give Flink only 25gb of memory on that machine and see how the process behaves over time: If it still runs out of memory eventually, then something is really wrong. But leaving only 2GB of memory for the operating system and unforeseen allocations by the Flink process is problematic. So, I wonder if this keyBy(userid) + ValueState combo caused the memory leak, because there will always be new keys getting into the stream. But since state is allocated in RocksDB, we would just see the disk running full, if that's the case. If there are leaking references on the heap, we would see OutOfMemory exceptions from the JVM. But here the operating system is killing your JVM, hence I believe we don't have a problem on the heap. On Wed, Jun 16, 2021 at 4:15 AM Mu Kong <[hidden email]> wrote:
|


| Free forum by Nabble | Edit this page |