Suspected classloader leak in Flink 1.11.1
Suspected classloader leak in Flink 1.11.1
|
Hey all,
We are encountering memory issues on a Flink client and task managers, which I would like to raise here.
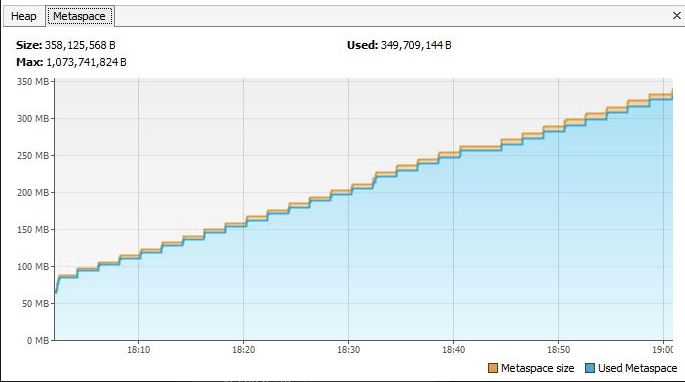
we are running Flink on a session cluster (version 1.11.1) on Kubernetes, submitting batch jobs with Flink client on Spring boot application (using RestClusterClient). When jobs are being submitted and running, one after another, We see that the metaspace memory(with max size of 1GB) keeps increasing, as well as linear increase in the heap memory (though it's a more moderate increase). We do see GC working on the heap and releasing some resources. By analyzing the memory of the client Java application with profiling tools, We saw that there are many instances of Flink's ChildFirstClassLoader (perhaps as the number of jobs which were running), and therefore many instances of the same class, each from a different instance of the Class Loader (as shown in the attached screenshot). Similarly, to the Flink task manager memory. We would expect to see one instance of Class Loader. Therefore, We suspect that the reason for the increase is Class Loaders not being cleaned. Does anyone have some insights about this issue, or ideas how to proceed the investigation?
Flink Client application (VisualVm)

Task Manager
Total Size 4GB metaspace 1GB Off heap 512mb
Screenshot form Task manager, 612MB are occupied and not being released. 
We used jcmd tool and attached 3 files
In addition, we have tried calling GC manually, but it did not change much.
Thank you

|
Re: Suspected classloader leak in Flink 1.11.1
|
Hi Tamir, You could check https://ci.apache.org/projects/flink/flink-docs-stable/ops/debugging/debugging_classloading.html#unloading-of-dynamically-loaded-classes-in-user-code for known class loading issues. Besides this, I think GC.class_histogram(even filtered) could help us listing suspected objects. Best, Kezhu Wang On February 28, 2021 at 21:25:07, Tamir Sagi ([hidden email]) wrote:
|
Re: Suspected classloader leak in Flink 1.11.1
|
I'd suggest to take a heap dump and
investigate what is referencing these classloaders; chances are
that some thread isn't being cleaned up.
On 2/28/2021 3:46 PM, Kezhu Wang wrote:
|
Re: Suspected classloader leak in Flink 1.11.1
|
In reply to this post by Kezhu Wang
Hey Kezhu,
The histogram has been taken from Task Manager using jcmd tool.
Yes, we have a batch app. we read a file from s3 using hadoop-s3-plugin, then map that data into DataSet then just print it.
Then we have a Flink Client application which saves the batch app jar.
Attached the following files:
I've noticed 2 behaviors:
Attached Task Manager Logs from yesterday after a single batch execution.(Memory grew to 612MB and never freed)
Same behavior has been observed in Flink Client application. Once the batch job is executed the memory is increased gradually
and does not get cleaned afterwards.(We observed many ChildFirstClassLoader instances)
Thank you
Tamir.
From: Kezhu Wang <[hidden email]>
Sent: Sunday, February 28, 2021 6:57 PM To: Tamir Sagi <[hidden email]> Subject: Re: Suspected classloader leak in Flink 1.11.1
HI Tamir,
The histogram has no instance of `ChildFirstClassLoader`.
> we are running Flink on a session cluster (version 1.11.1) on Kubernetes, submitting batch jobs with Flink client on Spring boot application (using RestClusterClient).
> By analyzing the memory of the client Java application with profiling tools, We saw that there are many instances of Flink's ChildFirstClassLoader (perhaps as the number of jobs which were running),
and therefore many instances of the same class, each from a different instance of the Class Loader (as shown in the attached screenshot). Similarly, to the Flink task manager memory.
By means of batch job, do you means that you compile job graph from DataSet API in client side and then submit it through RestClient ? I am not familiar with data set api, usually, there is no `ChildFirstClassLoader` creation in client side for job graph building.
Could you depict a pseudo for this or did you create `ChildFirstClassLoader` yourself ?
> In addition, we have tried calling GC manually, but it did not change much.
It might take serval runs to collect a class loader instance.
Best,
Kezhu Wang
On February 28, 2021 at 23:27:38, Tamir Sagi ([hidden email]) wrote:

|
Re: Suspected classloader leak in Flink 1.11.1
|
Hi Tamir, > The histogram has been taken from Task Manager using jcmd tool. From that histogram, I guest there is no classloader leaking. > A simple batch job with single operation . The memory bumps to ~600MB (after single execution). once the job is finished the memory never freed. It could be just new code paths and hence new classes. A single execution does not making much sense. Multiple or dozen runs and continuous memory increasing among them and not decreasing after could be symptom of leaking. You could use following steps to verify whether there are issues in your task managers: * Run job N times, the more the better. * Wait all jobs finished or stopped. * Trigger manually gc dozen times. * Take class histogram and check whether there are any “ChildFirstClassLoader”. * If there are roughly N “ChildFirstClassLoader” in histogram, then we can pretty sure there might be class loader leaking. * If there is no “ChildFirstClassLoader” or few but memory still higher than a threshold, say ~600MB or more, it could be other shape of leaking. In all leaking case, an heap dump as @Chesnay said could be more helpful since it can tell us which object/class/thread keep memory from freeing. Besides this, I saw an attachment “task-manager-thrad-print.txt” in initial mail, when and where did you capture ? Task Manager ? Is there any job still running ? Best, Kezhu Wang On March 1, 2021 at 18:38:55, Tamir Sagi ([hidden email]) wrote:
|
Re: Suspected classloader leak in Flink 1.11.1
|
Hey,
I'd expect that what happens in a single execution will repeat itself in N executions.
I ran entire cycle of jobs(28 jobs).
Once it finished:
Prior running the tests I started Flight recording using "jcmd 1 JFR.start ", I stopped it after calling GC ~100 times.
Following figure shows the graphs from "recording.jfr" in Virtual Vm.
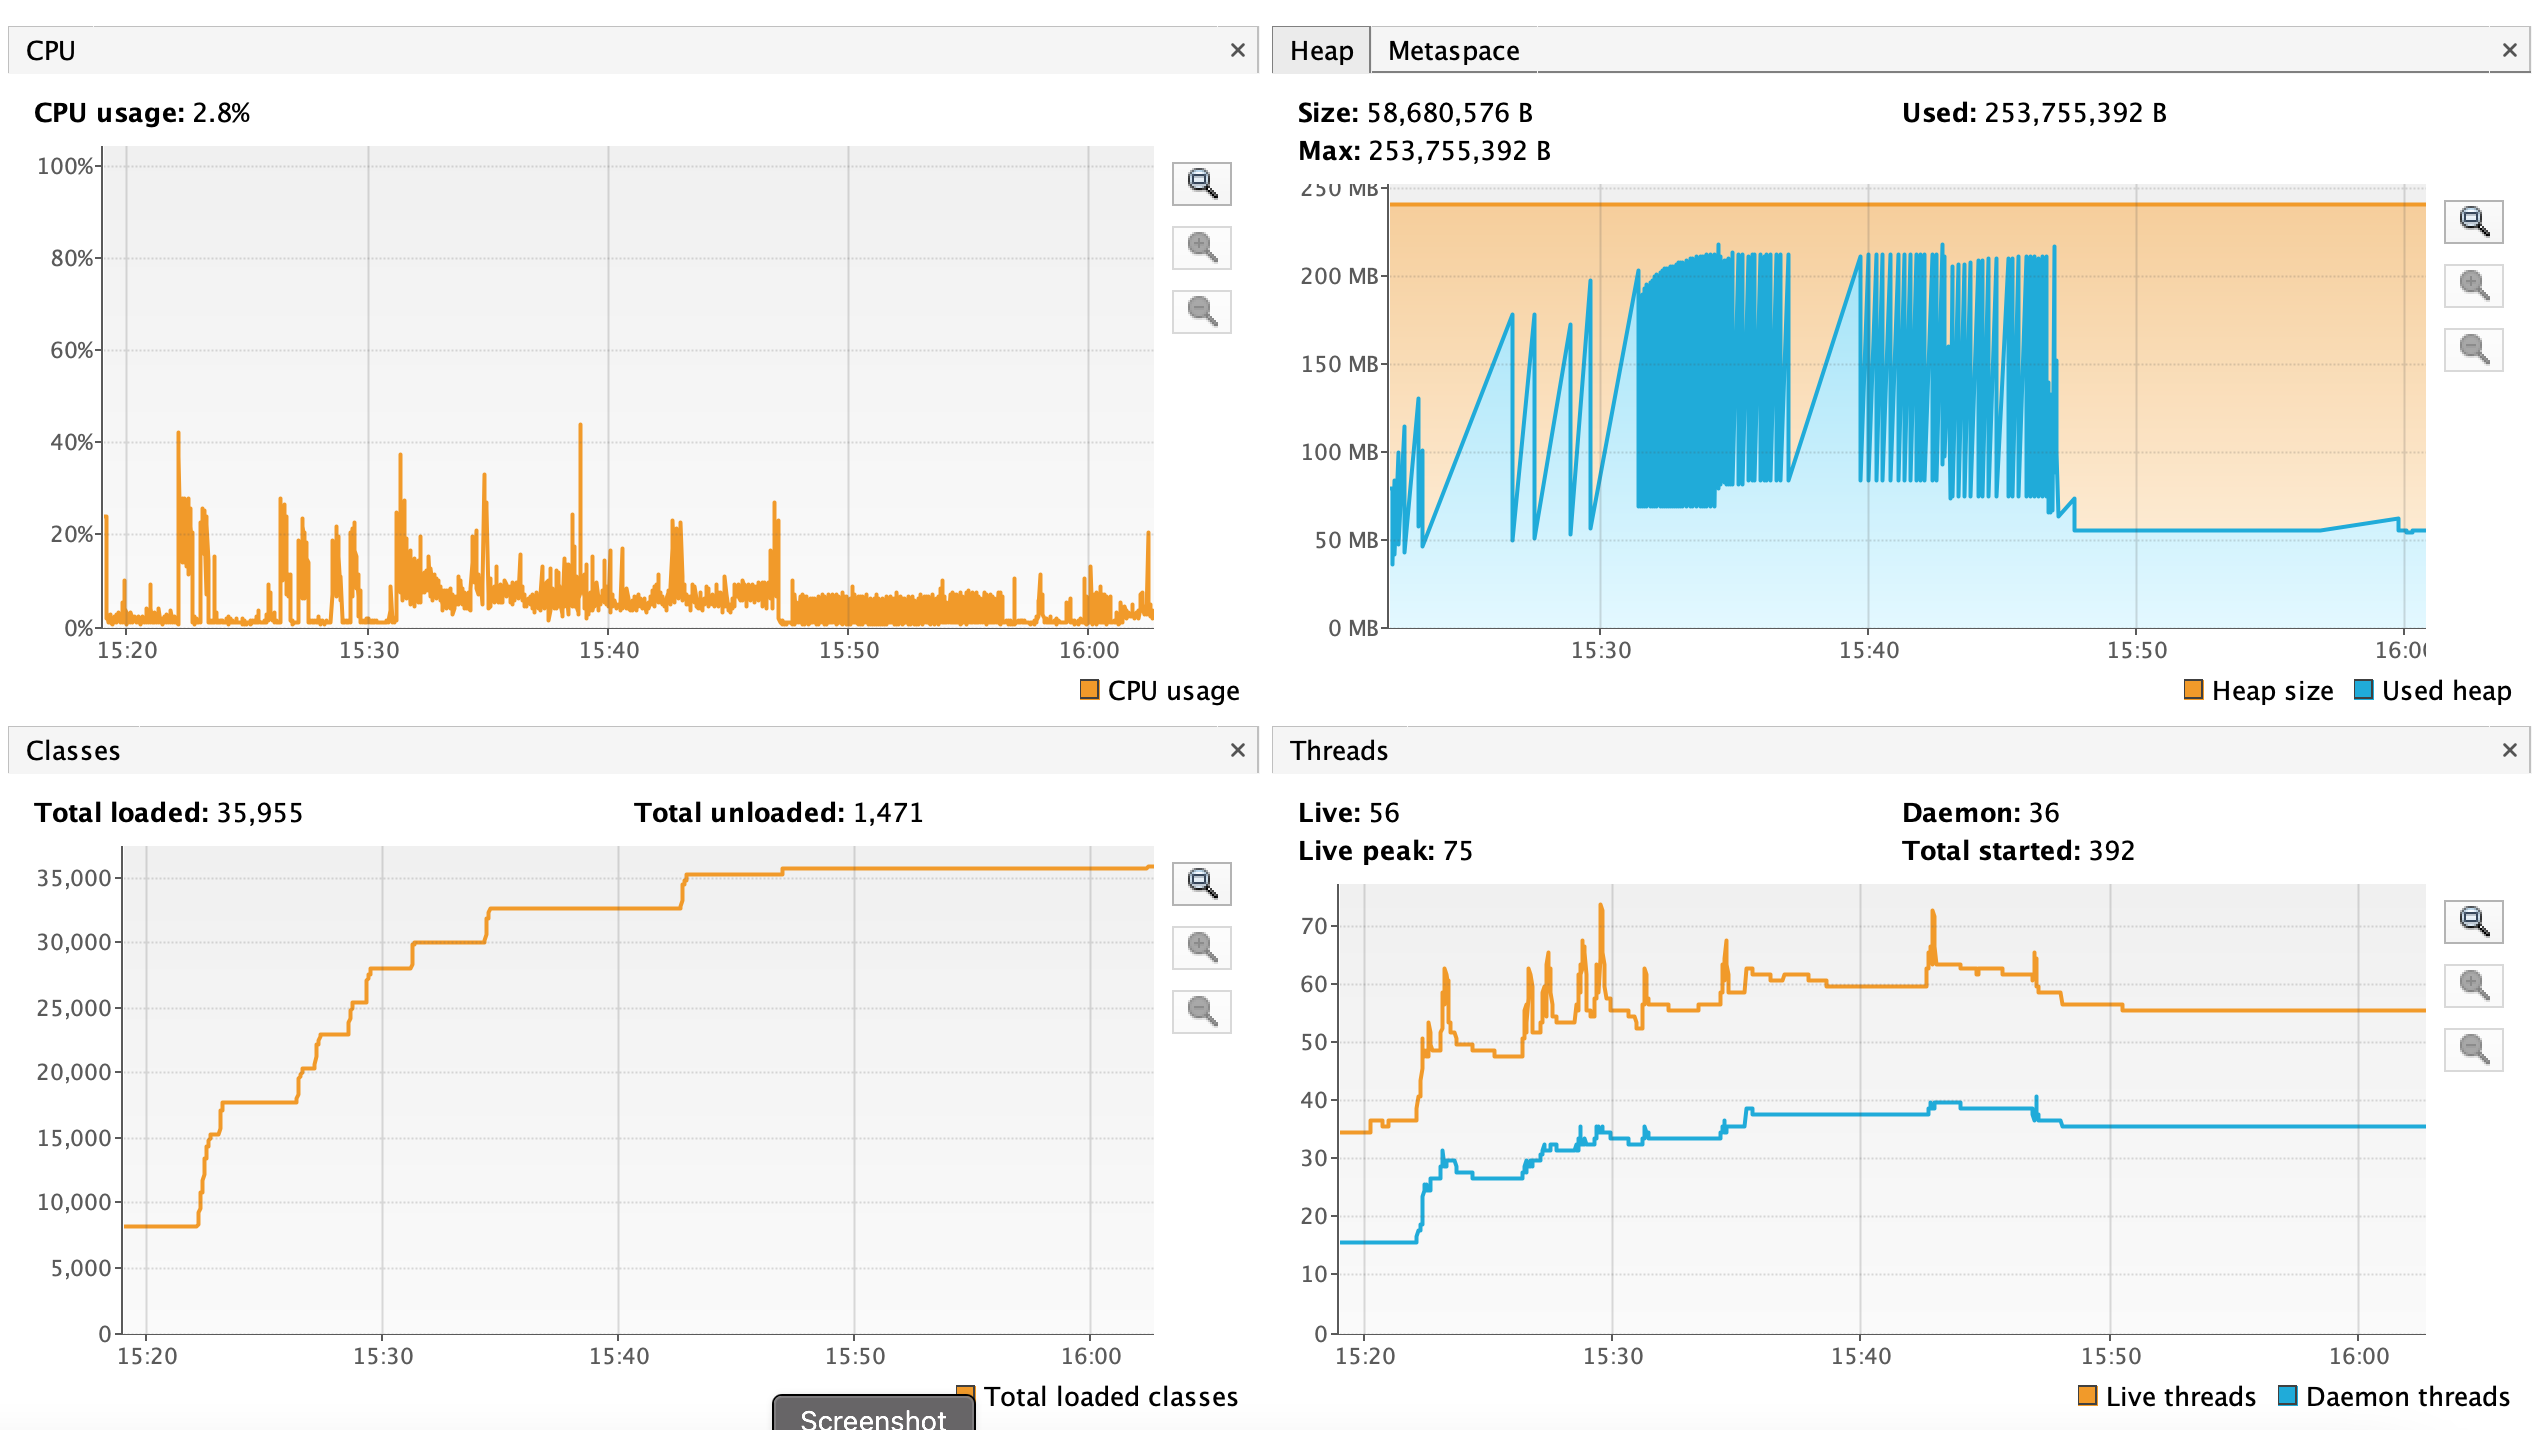 and Metaspace(top right) 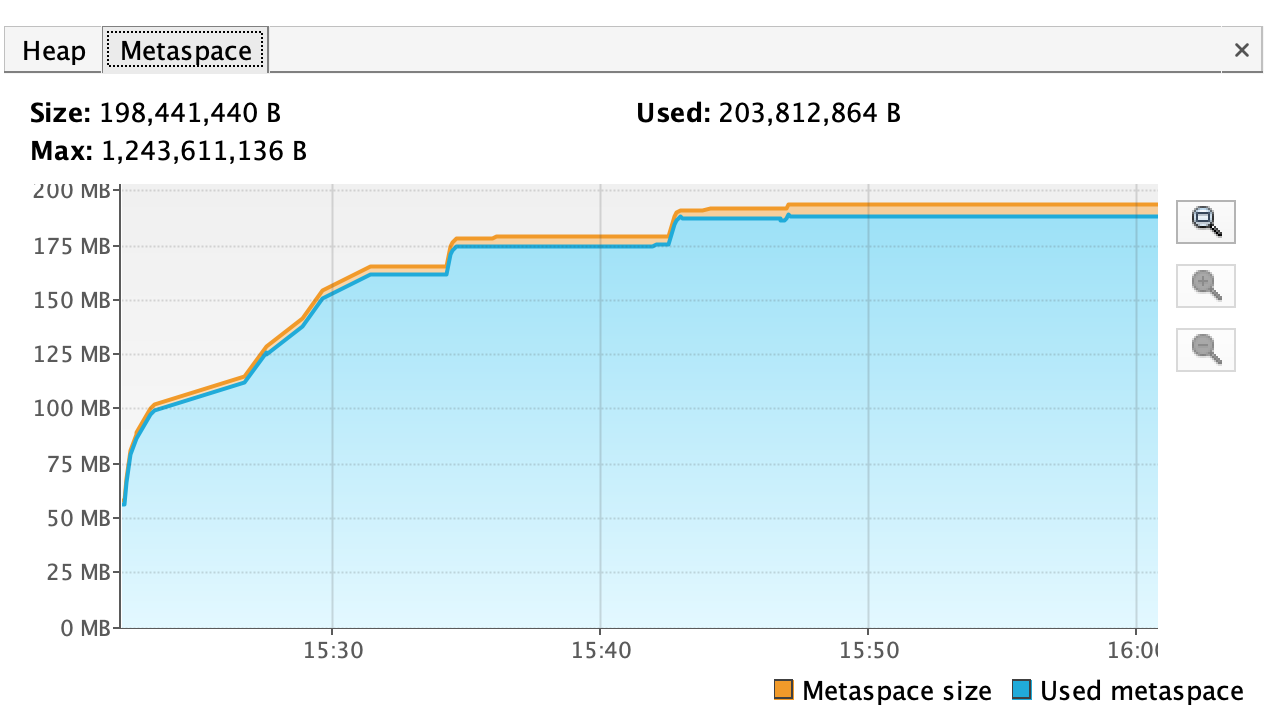
docker stats command filtered to relevant Task manager container

Following files of task-manager are
attached :
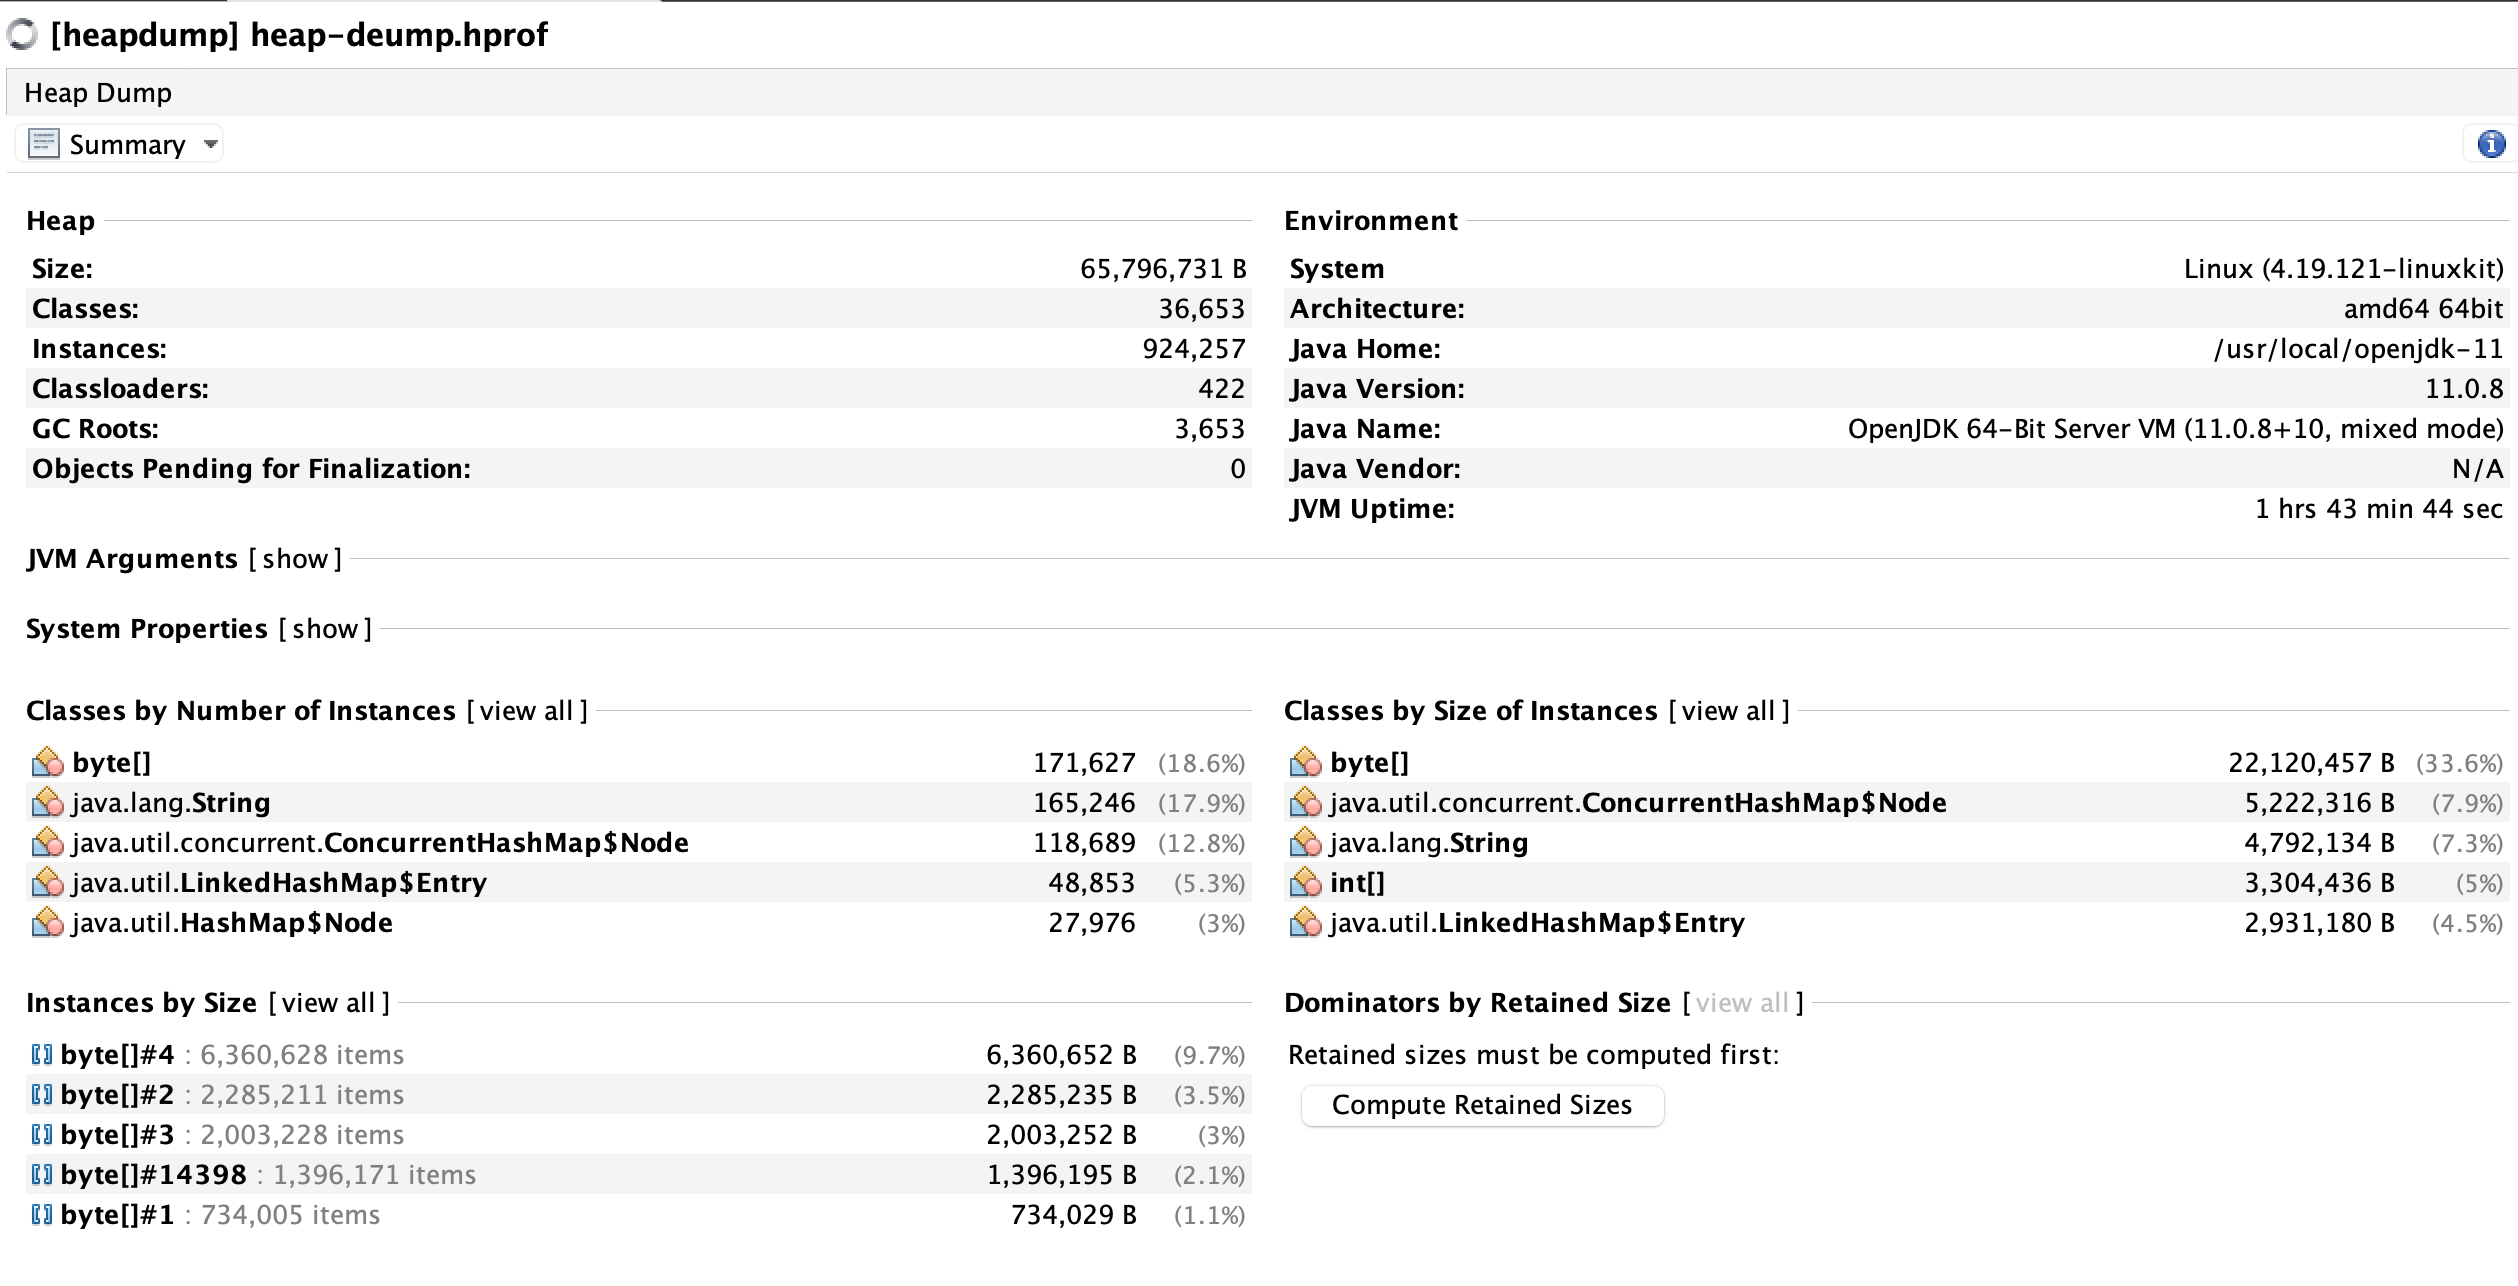
Task manager heap dump is ~100MB,
here is a summary:
Flink client app metric(taken from Lens):

We see a tight coupling between Task Manager app and Flink Client app, as the batch job runs on the client side(via reflection)
what happens with class loaders in that case?
we also noticed many logs in Task manager related to PoolingHttpClientConnectionManager

and IdleConnectionReaper InterruptedException

On Client app we noticed many instances of that thread (From heap dump)
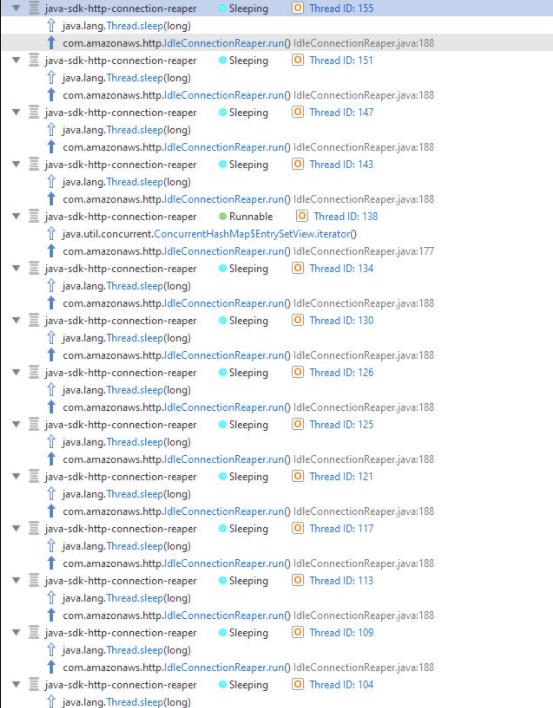
We uploaded 2 heap dumps and task-manager flight recording file into Google drive
Thanks,
Tamir.

From: Kezhu Wang <[hidden email]>
Sent: Monday, March 1, 2021 2:21 PM To: [hidden email] <[hidden email]>; Tamir Sagi <[hidden email]> Subject: Re: Suspected classloader leak in Flink 1.11.1
Hi Tamir,
> The histogram has been taken from Task Manager using jcmd tool.
From that histogram, I guest there is no classloader leaking.
> A simple batch job with single operation . The memory bumps to ~600MB (after single execution). once the job is finished the memory never freed.
It could be just new code paths and hence new classes. A single execution does not making much sense. Multiple or dozen runs and continuous memory increasing among them and not decreasing after could
be symptom of leaking.
You could use following steps to verify whether there are issues in your task managers:
* Run job N times, the more the better.
* Wait all jobs finished or stopped.
* Trigger manually gc dozen times.
* Take class histogram and check whether there are any “ChildFirstClassLoader”.
* If there are roughly N “ChildFirstClassLoader” in histogram, then we can pretty sure there might be class loader leaking.
* If there is no “ChildFirstClassLoader” or few but memory still higher than a threshold, say ~600MB or more, it could be other shape of leaking.
In all leaking case, an heap dump as @Chesnay said could be more helpful since it can tell us which object/class/thread keep memory from freeing.
Besides this, I saw an attachment “task-manager-thrad-print.txt” in initial mail, when and where did you capture ? Task Manager ? Is there any job still running ?
Best,
Kezhu Wang
On March 1, 2021 at 18:38:55, Tamir Sagi ([hidden email]) wrote:
|
Re: Suspected classloader leak in Flink 1.11.1
|
the java-sdk-connection-reaper thread and amazon's JMX integration are causing the leak.
What strikes me as odd is that I see some dynamodb classes being referenced in the child classloaders, but I don't see where they could come from based on the application that you provided us with.
Could you clarify how exactly you depend on Amazon dependencies?
(connectors, filesystems, _other stuff_) On 3/1/2021 5:24 PM, Tamir Sagi wrote:
|
Re: Suspected classloader leak in Flink 1.11.1
|
Hi Chesnay, Thanks for give a hand and solve this. I guess `FlatMapXSightMsgProcessor` is a minimal reproducible version while the heap dump could be taken from near production environment. Best, Kezhu Wang On March 2, 2021 at 01:00:52, Chesnay Schepler ([hidden email]) wrote:
|
Re: Suspected classloader leak in Flink 1.11.1
|
Thank you Kezhu and Chesnay,
The code I provided you is a minimal code to show what is executed as part of the batch along the Flink client app. you were right that it's not consistent with the heap dump. (which has been taken in dev env)
We run multiple Integration tests(Job per test) against Flink session cluster(Running on Kubernetes). with 2 task manager, single job manager. The jobs are submitted via Flink Client app which runs on top of spring boot application along Kafka.
I suspected that
IdleConnectionReaper is the root cause to some sort of leak(In the flink client app) however, I was trying to manually shutdown the IdleConnectionReaper Once the job finished.
via calling
"com.amazonaws.http.IdleConnectionReaper.shutdown()". - which is
suggested as a workaround.
It did not affect much. the memory has not been released .(shutdown method always returns false, the instance is null) ref: https://github.com/aws/aws-sdk-java/blob/master/aws-java-sdk-core/src/main/java/com/amazonaws/http/IdleConnectionReaper.java#L148-L157
On the batch code , I added close method which close the connections to aws clients once the operation finished. it did not help either, as the memory keep growing
gradually.
We came across the following setting
any more ideas based on the heap dump/Flight recording(Task manager)?
Is it correct that the Flink client & Task manager are strongly coupled?
Thanks,
Tamir.
From: Kezhu Wang <[hidden email]>
Sent: Monday, March 1, 2021 7:54 PM To: Tamir Sagi <[hidden email]>; [hidden email] <[hidden email]>; Chesnay Schepler <[hidden email]> Subject: Re: Suspected classloader leak in Flink 1.11.1
Hi Chesnay,
Thanks for give a hand and solve this.
I guess `FlatMapXSightMsgProcessor` is a minimal reproducible version while the heap dump could be taken from near production environment.
Best,
Kezhu Wang
On March 2, 2021 at 01:00:52, Chesnay Schepler ([hidden email]) wrote:

|
Re: Suspected classloader leak in Flink 1.11.1
|
The client and TaskManager are not
coupled in any way. The client serializes individual functions
that are transmitted to the task managers, deserialized and run.
Hence, if your functions rely on any
library that needs cleanup then you must add this to the
respective function, likely by extending the RichFunction
variants, to ensure this cleanup is executed on the task manager.
On 3/2/2021 4:52 PM, Tamir Sagi wrote:
|
Re: Suspected classloader leak in Flink 1.11.1
|
Hi all, @Chesnay is right, there is no code execution coupling between client and task manager. But before job is submitted to flink cluster, client need various steps to build a job graph for submission. These steps could includes: * Construct user functions. * Construct runtime stream operator if necessary. * Other possible unrelated steps. The constrcuted functions/operators are only *opened* for function in flink cluster not client. There are no cleanup operations for these functions/operators in client side. If you ever do some resources consuming in construction of these functions/operators, then you probably will leak these consumed resources in client side. In your case, these resources consuming operations could be: * Register `com.amazonaws.metrics.MetricAdmin` mbean directly or indirectly. * Start `IdleConnectionReaper` directly or indirectly. For task manager side resource cleanup, `RuntimeContext.registerUserCodeClassLoaderReleaseHookIfAbsent` could also be useful for global resource cleanup such as mbean un-registration. Besides this, I observed two additional symptoms which might be useful: * "kafka-producer-network-thread"(loaded through AppClassLoader) still running. * `MetricAdmin` mbean and `IdleConnectionReaper` are also loaded by `PluginClassLoader`. Outside `PackagedProgramUtils.createJobGraph`, the class loader is your application class loader while the leaking resources is created inside `createJoGraph` through `ChildFirstClassLoader`. Best, Kezhu Wang
On March 3, 2021 at 02:33:58, Chesnay Schepler ([hidden email]) wrote:
|
| Free forum by Nabble | Edit this page |


