Streaming job monitoring

classic Classic list List threaded Threaded
3 messages Options
Reply | Threaded
Open this post in threaded view
|

Streaming job monitoring

Flavio Pompermaier
Hi to all,
we've successfully ran our first straming job on a Flink cluster (with some problems with the shading of guava..) and it really outperforms Logstash, from the point of view of indexing speed and easiness of use.

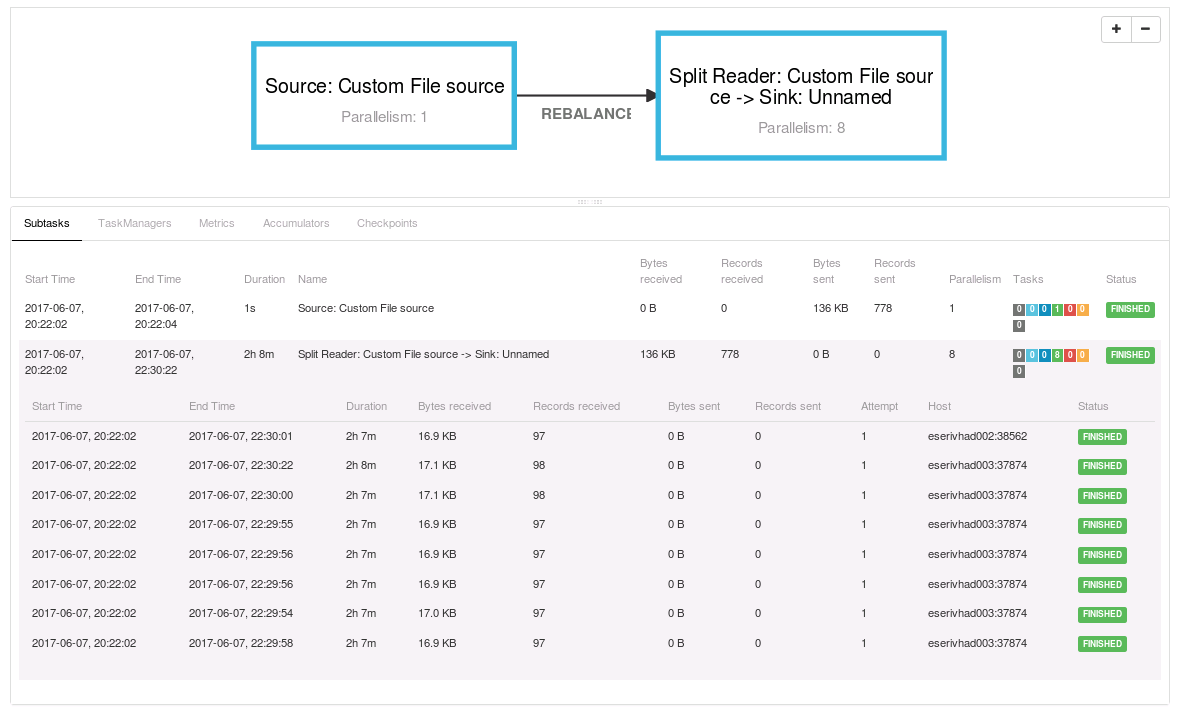
However there's only one problem: when the job is running, in the Job Monitoring UI, I see 2 blocks within the plan visualizer:
  1. Source: Custom File Source (without any info about the file I'm reading)
  2. Split Reader: Custom File source -> Sink: unnamed
None of them helps me to understand which data I'm reading or writing (while within the batch jobs this is usually displayed). Moreover, in the task details the "Byte sent/Records sent" are totally senseless, I don't know what is counted (see the attached image if available)...I see documents indexed on ES but in the Flink Job UI I don't see anything that could help to understand how many documents are sent to ES or from one function (Source) to the other (Sink).
I tried to display some metrics and there I found something but I hope this is not the usual way of monitoring streaming jobs...am I doing something wrong? Or the streaming jobs should be monitored with something else?

Inline image 1
Best,
Flavio
Reply | Threaded
Open this post in threaded view
|

Re: Streaming job monitoring

Chesnay Schepler
Hello Flavio,

I'm not sure what source you are using, but it looks like the ContinouosFileMonitoringSource which works with 2 operators.
The first operator (what is displayed as the actual Source) emits input splits (chunks of files that should be read) and passes
these to the second operator (split reader).

So the numRecordsOut of the source is the number of splits created.

For sinks, the numRecordsOut counter is essentially unused; mostly because it is kind of redundant as it should in general
be equal to the numRecordsIn counter. The same applies to the numRecordsIn counter of sources.
(although in this particular case it would be interesting to know how many files the source has read...)

This is something we would have to solve for each source/sink individually, which is kind of tricky as the numRecordsIn/-Out
metrics are internal metrics and not accessible in user-defined functions without casting.

In your case the reading of the chunks and writing by the sink is done in a single task. The webUI is not aware of operators
and thus can't display the individual metrics nicely.

The metrics tab doesn't aggregate metrics across subtasks, so I can see how that would be cumbersome to use. We can't solve
aggregation in general as when dealing with Gauges we just don't know whether we can aggregate them at all.
Frankly, this is also something I don't really won't to implement in the first place as there are dedicated systems for this
exact use-case. The WebFrontend is not meant as a replacement for these systems.

In general i would recommend to setup a dedicated metrics system like graphite/ganglia to store metrics and use grafana
or something similar to actually monitor them.

Regards,
Chesnay

On 08.06.2017 11:43, Flavio Pompermaier wrote:
Hi to all,
we've successfully ran our first straming job on a Flink cluster (with some problems with the shading of guava..) and it really outperforms Logstash, from the point of view of indexing speed and easiness of use.

However there's only one problem: when the job is running, in the Job Monitoring UI, I see 2 blocks within the plan visualizer:
  1. Source: Custom File Source (without any info about the file I'm reading)
  2. Split Reader: Custom File source -> Sink: unnamed
None of them helps me to understand which data I'm reading or writing (while within the batch jobs this is usually displayed). Moreover, in the task details the "Byte sent/Records sent" are totally senseless, I don't know what is counted (see the attached image if available)...I see documents indexed on ES but in the Flink Job UI I don't see anything that could help to understand how many documents are sent to ES or from one function (Source) to the other (Sink).
I tried to display some metrics and there I found something but I hope this is not the usual way of monitoring streaming jobs...am I doing something wrong? Or the streaming jobs should be monitored with something else?

Inline image 1
Best,
Flavio


Reply | Threaded
Open this post in threaded view
|

Re: Streaming job monitoring

Flavio Pompermaier
Hi Chesnay,
this is basically my job:

TextInputFormat input = new TextInputFormat(new Path(jsonDir, fileName));
DataStream<String> json = env.createInput(input, BasicTypeInfo.STRING_TYPE_INFO);
json.addSink(new ElasticsearchSink<>(userConf, transportAddr, sink));
JobExecutionResult jobInfo = env.execute("ES indexing of " + fileName);

Maybe I could register an accumulator for the moment within the Sink and give it a name to input/output in order to understand what's going on (apart from job name).
Is there any tutorial on how to install Ganglia and connect it to Flink (apartĀ https://ci.apache.org/projects/flink/flink-docs-release-1.2/monitoring/metrics.html)?

Thanks for the support,
Flavio


On Thu, Jun 8, 2017 at 12:16 PM, Chesnay Schepler <[hidden email]> wrote:
Hello Flavio,

I'm not sure what source you are using, but it looks like the ContinouosFileMonitoringSource which works with 2 operators.
The first operator (what is displayed as the actual Source) emits input splits (chunks of files that should be read) and passes
these to the second operator (split reader).

So the numRecordsOut of the source is the number of splits created.

For sinks, the numRecordsOut counter is essentially unused; mostly because it is kind of redundant as it should in general
be equal to the numRecordsIn counter. The same applies to the numRecordsIn counter of sources.
(although in this particular case it would be interesting to know how many files the source has read...)

This is something we would have to solve for each source/sink individually, which is kind of tricky as the numRecordsIn/-Out
metrics are internal metrics and not accessible in user-defined functions without casting.

In your case the reading of the chunks and writing by the sink is done in a single task. The webUI is not aware of operators
and thus can't display the individual metrics nicely.

The metrics tab doesn't aggregate metrics across subtasks, so I can see how that would be cumbersome to use. We can't solve
aggregation in general as when dealing with Gauges we just don't know whether we can aggregate them at all.
Frankly, this is also something I don't really won't to implement in the first place as there are dedicated systems for this
exact use-case. The WebFrontend is not meant as a replacement for these systems.

In general i would recommend to setup a dedicated metrics system like graphite/ganglia to store metrics and use grafana
or something similar to actually monitor them.

Regards,
Chesnay


On 08.06.2017 11:43, Flavio Pompermaier wrote:
Hi to all,
we've successfully ran our first straming job on a Flink cluster (with some problems with the shading of guava..) and it really outperforms Logstash, from the point of view of indexing speed and easiness of use.

However there's only one problem: when the job is running, in the Job Monitoring UI, I see 2 blocks within the plan visualizer:
  1. Source: Custom File Source (without any info about the file I'm reading)
  2. Split Reader: Custom File source -> Sink: unnamed
None of them helps me to understand which data I'm reading or writing (while within the batch jobs this is usually displayed). Moreover, in the task details the "Byte sent/Records sent" are totally senseless, I don't know what is counted (see the attached image if available)...I see documents indexed on ES but in the Flink Job UI I don't see anything that could help to understand how many documents are sent to ES or from one function (Source) to the other (Sink).
I tried to display some metrics and there I found something but I hope this is not the usual way of monitoring streaming jobs...am I doing something wrong? Or the streaming jobs should be monitored with something else?

Inline image 1
Best,
Flavio