Skewed CPU utilization analysis
|
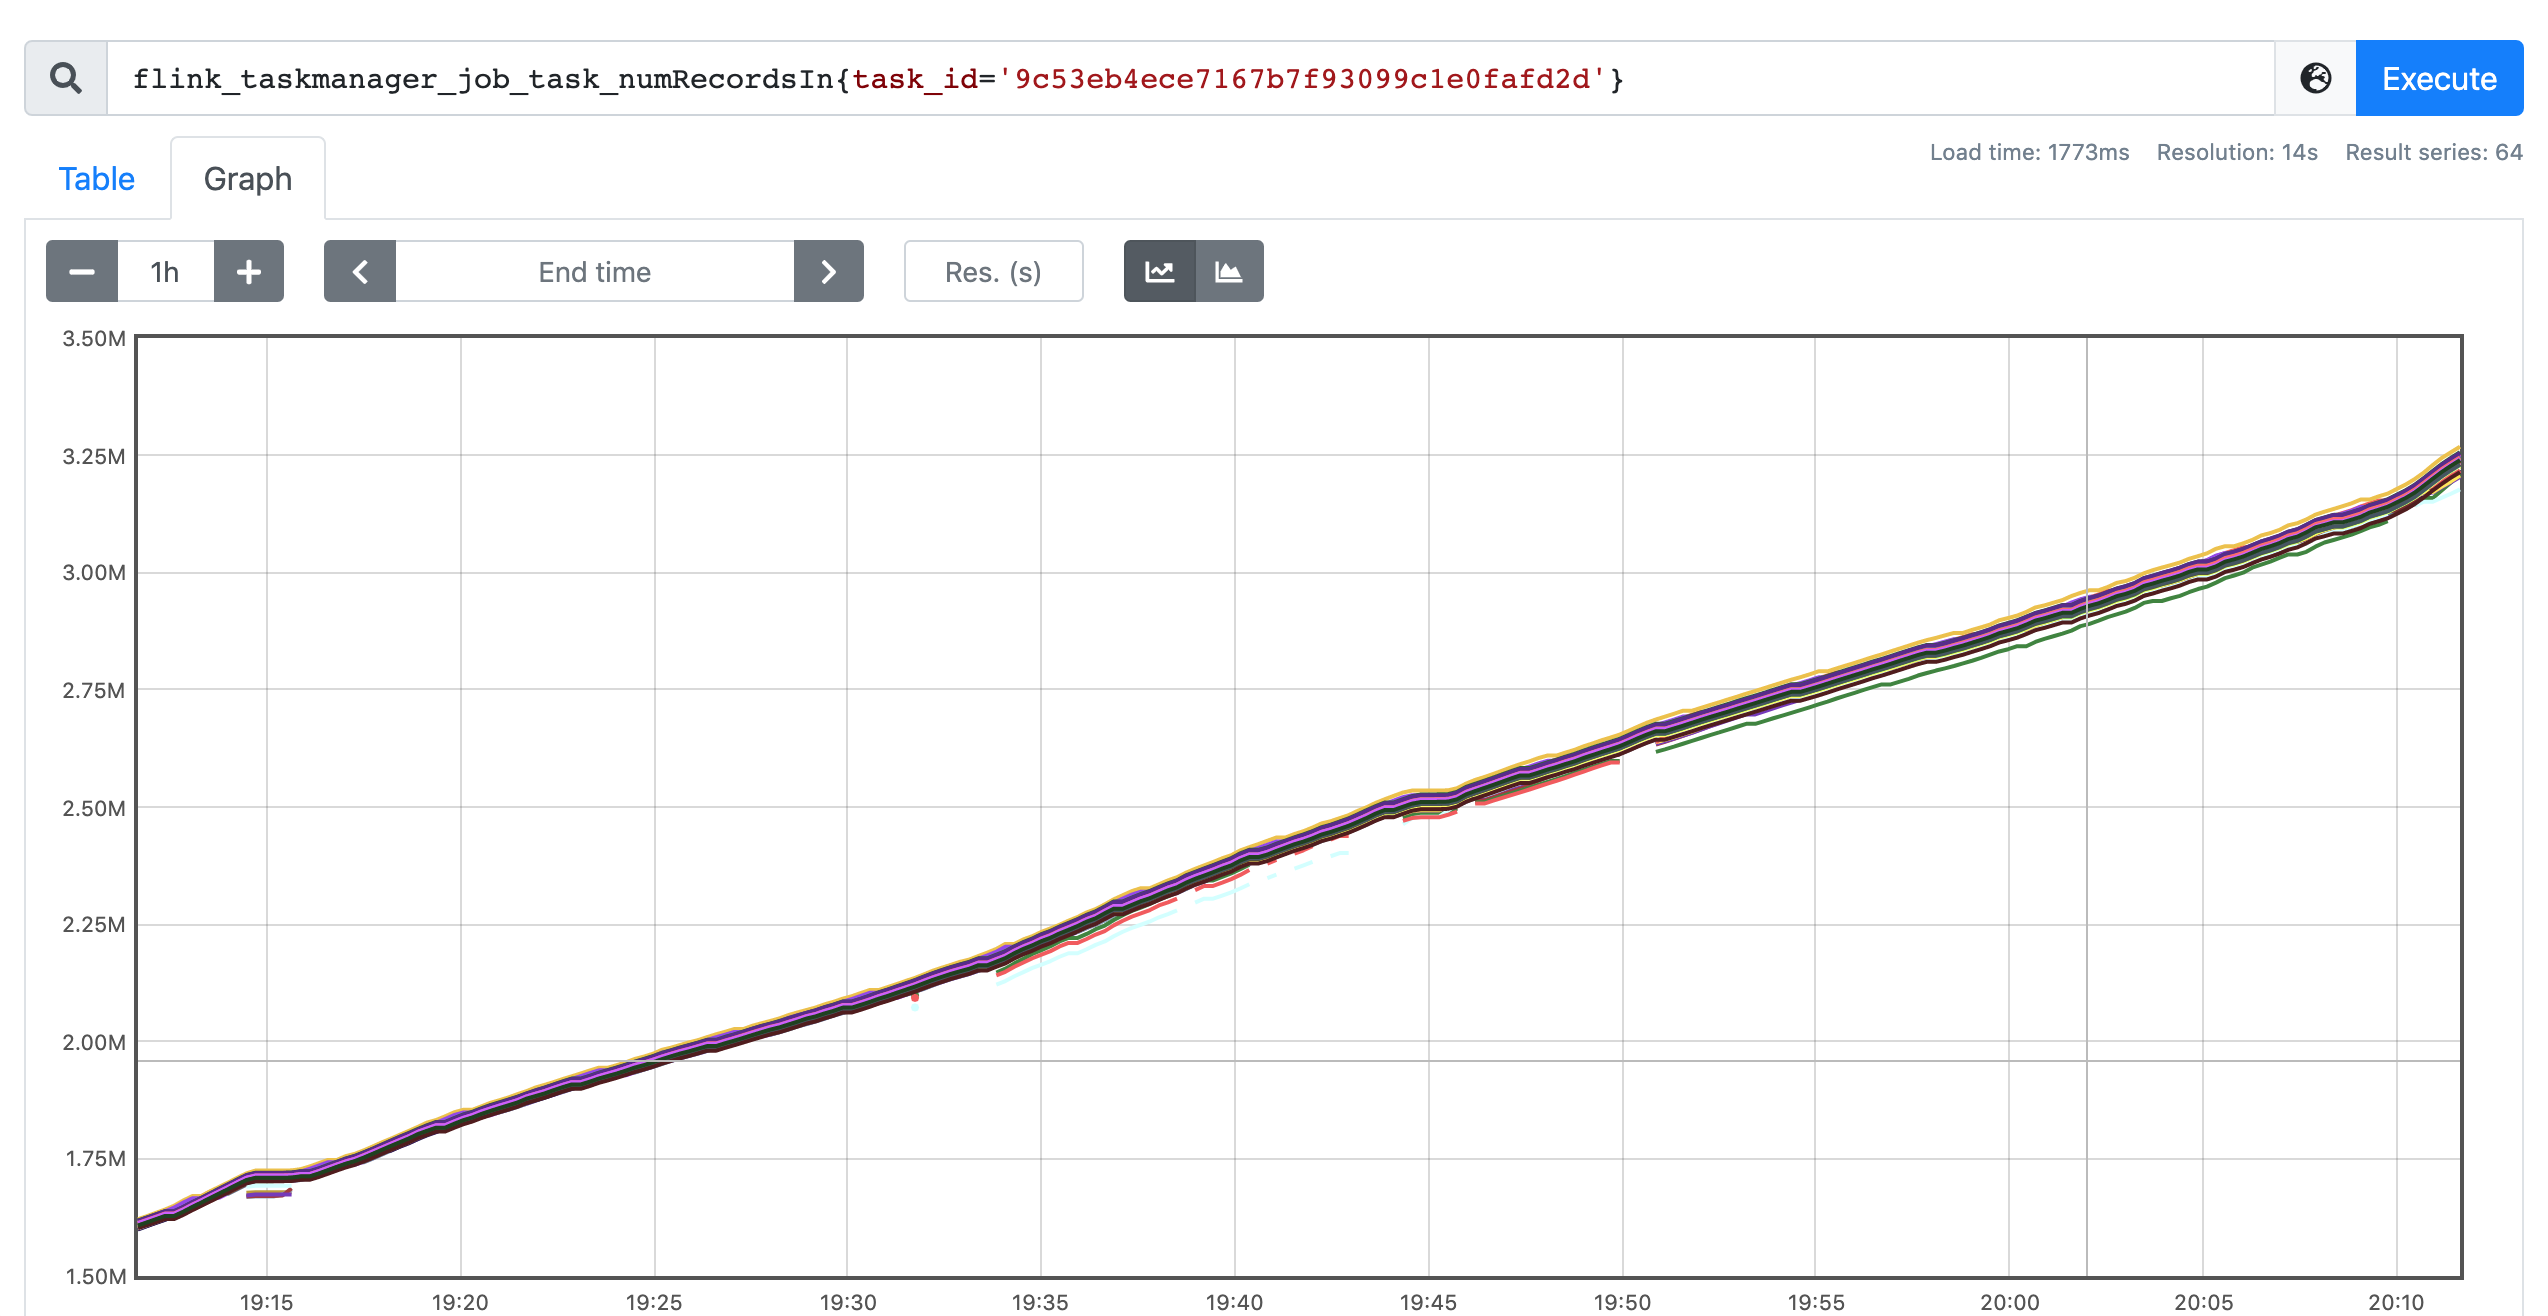
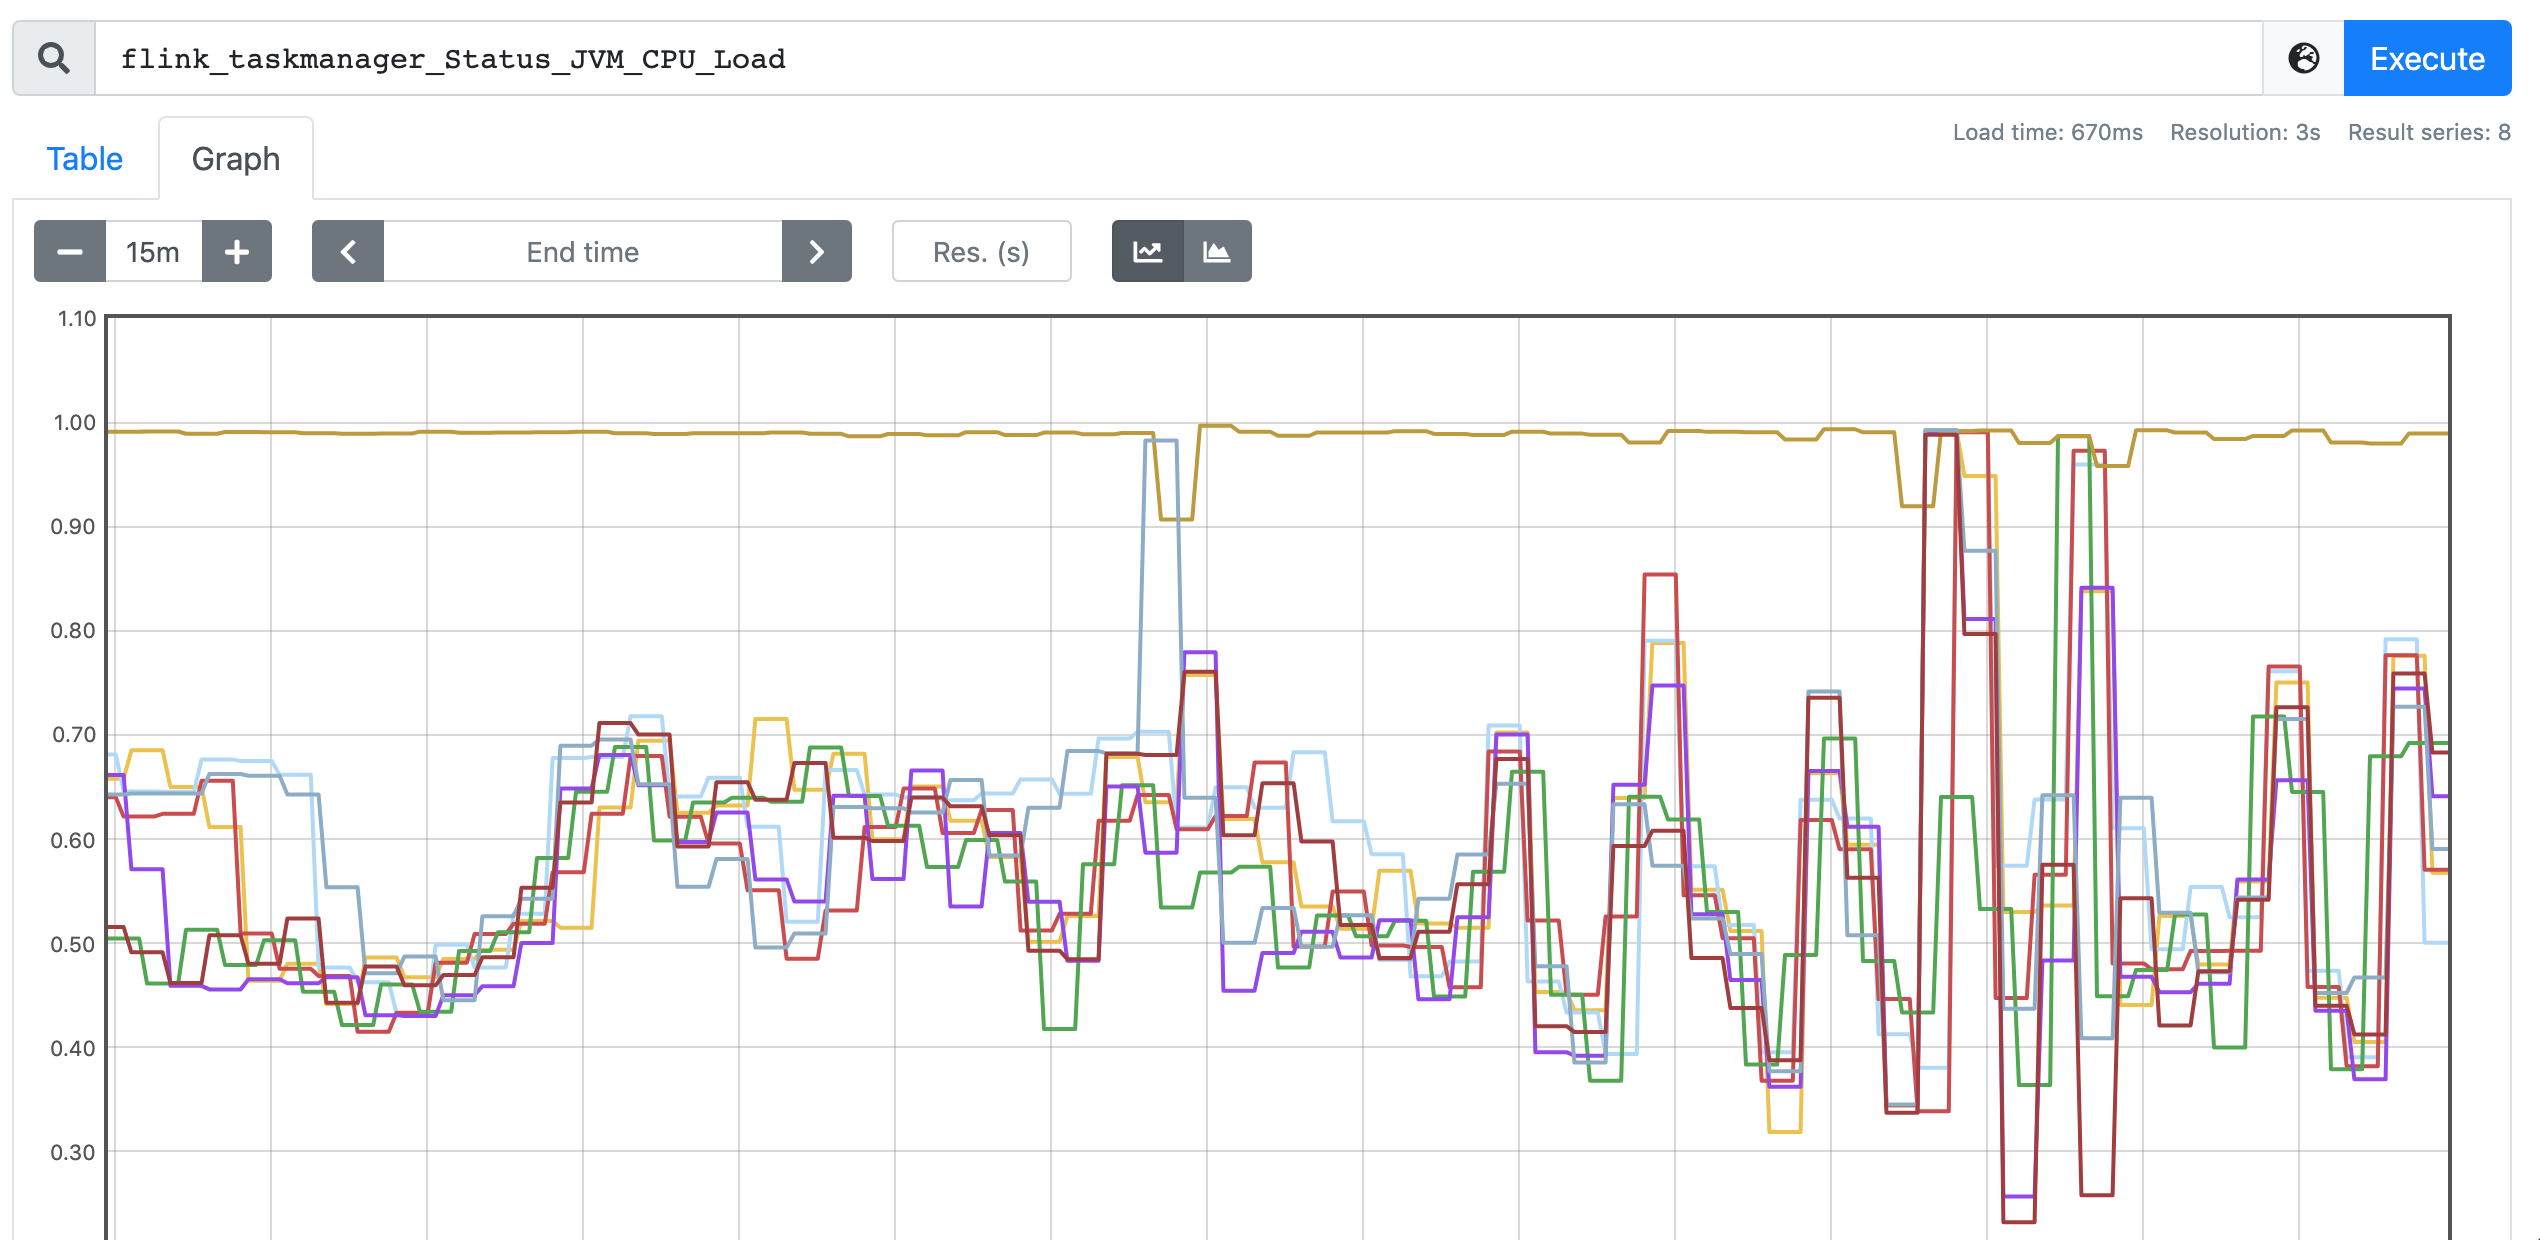
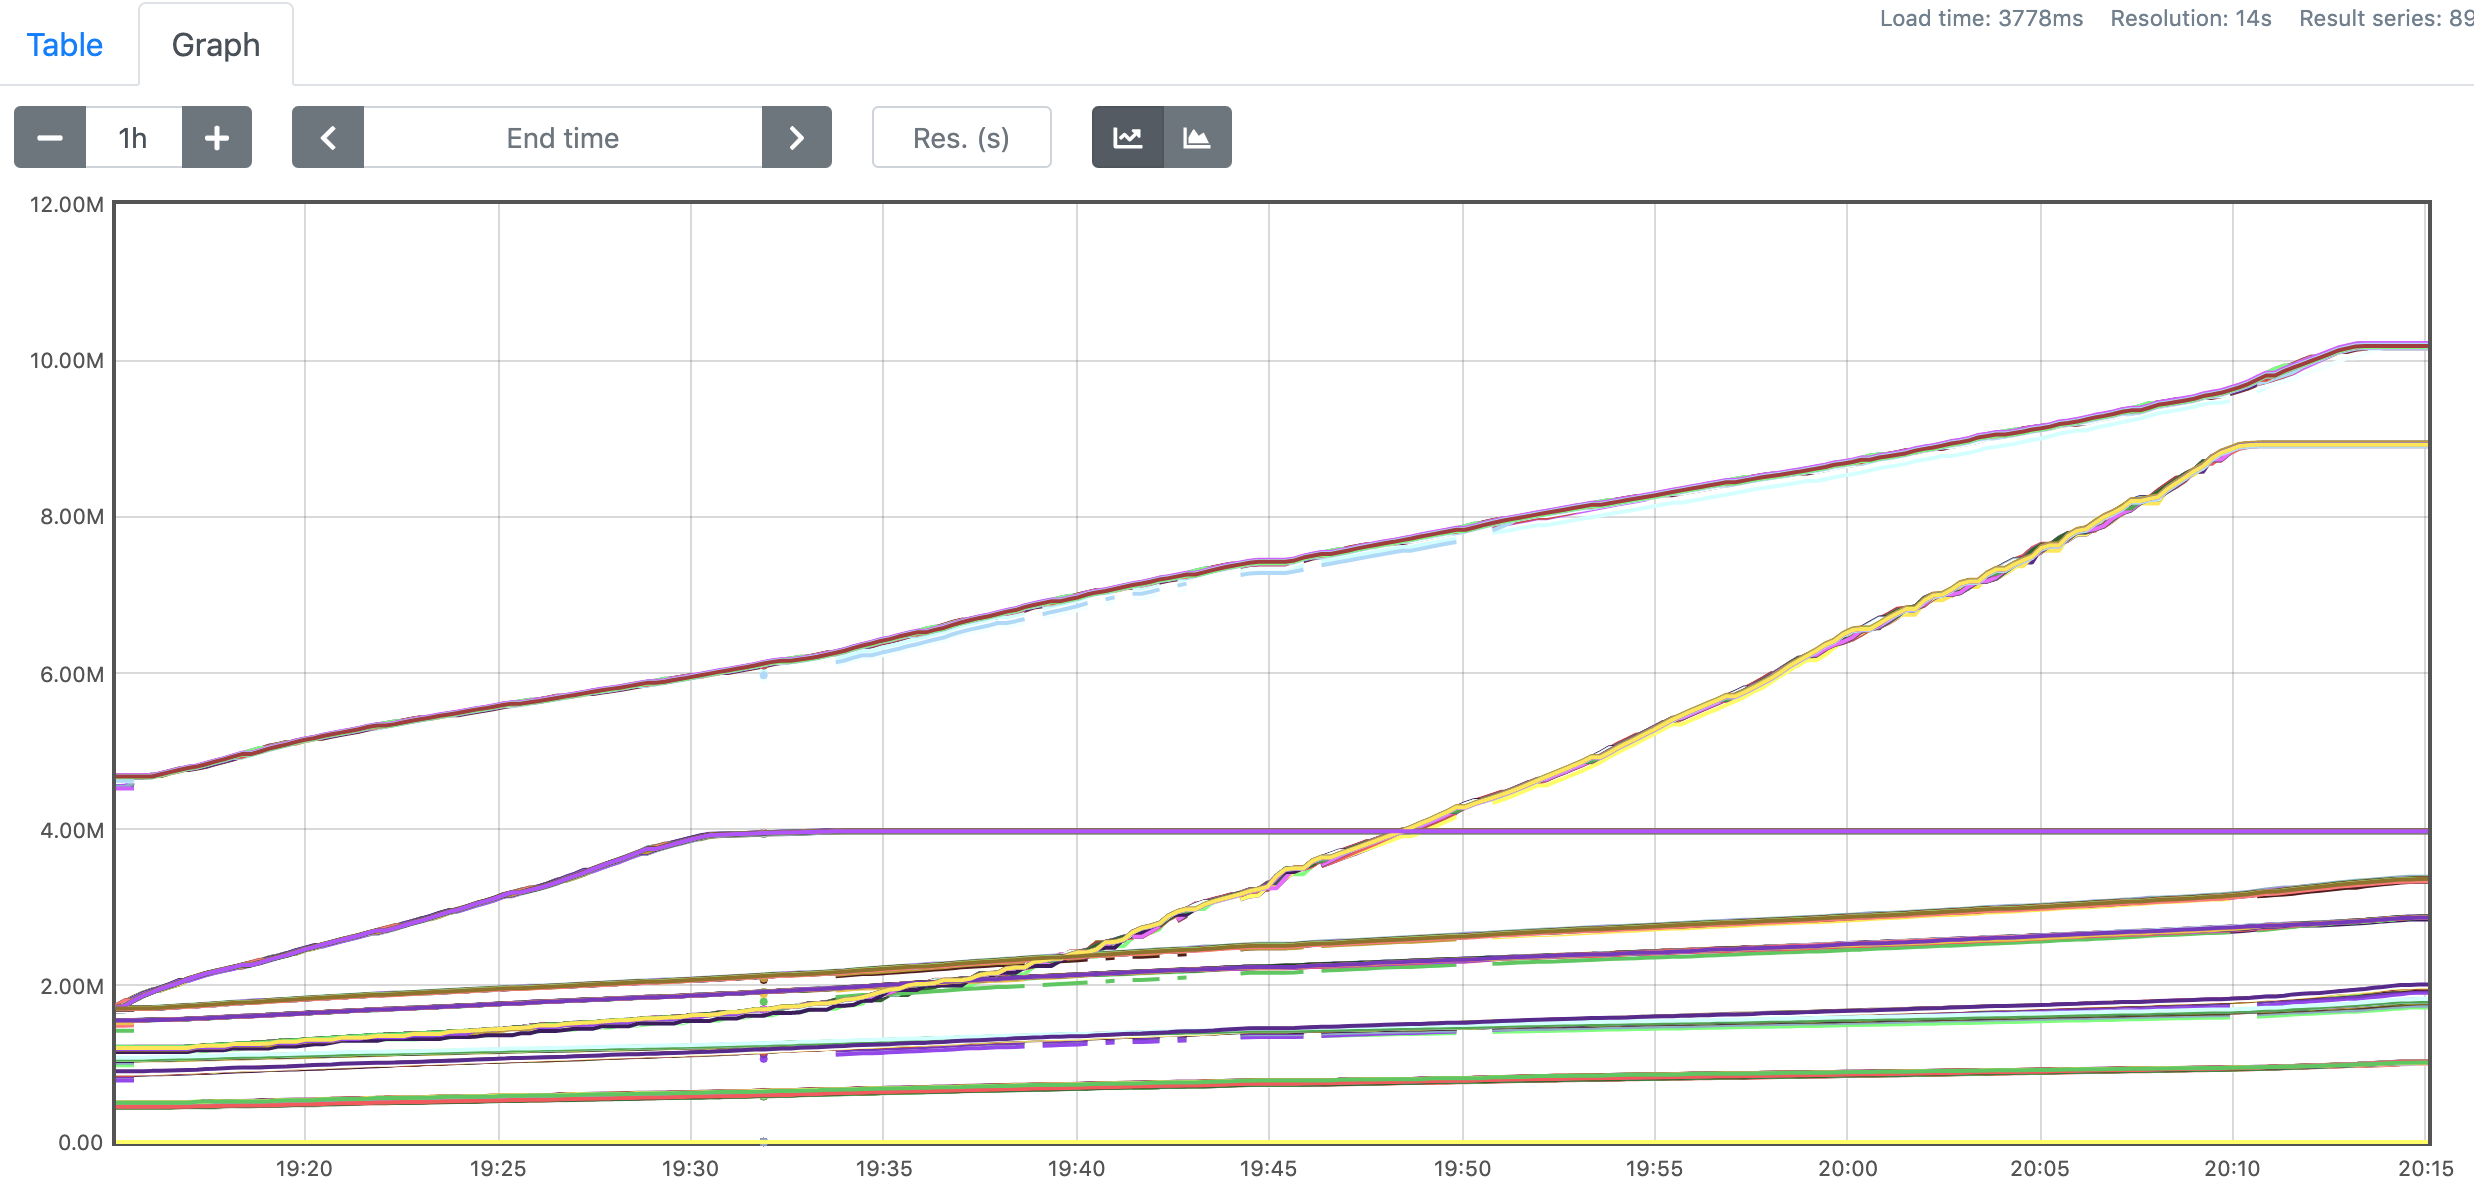
Hi team, We're using multiple joins to generate the dynamic view from Kafka stream. There are no data skew in our data input, and that can be verified by number of consumed records for all subtasks for one operator, they fit close as shown in the figure below. This is the metrics figure for the last operator and it's similar trend for other operators. While we faced a issue of skewed CPU utilization as shown in Figure-3. This does not happen everytime with the parallelism settings. Is there any guidance for further analysis on this?  Figure-1. number of consumed records for the last operator.  Figure-2. number of consumed records for all operators.  Figure-3. Skewed CPU utilization. Best wishes, - Kai |
Re: Skewed CPU utilization analysis
|
Hi Kai, what you could check is the deployment of tasks onto the TaskManagers. You could compare where the tasks are deployed when you see the skewed CPU utilization vs. when not. Maybe Flink deploys some of the tasks suboptimally when you observe the skewed CPU utilization. Additionally, you could sample the stack trace of the JVM which has the high CPU load. That way we could figure out what the TaskManager is doing and what keeps the CPU occupied. Cheers, Till On Thu, Apr 8, 2021 at 2:30 PM Kai Fu <[hidden email]> wrote:
|
|
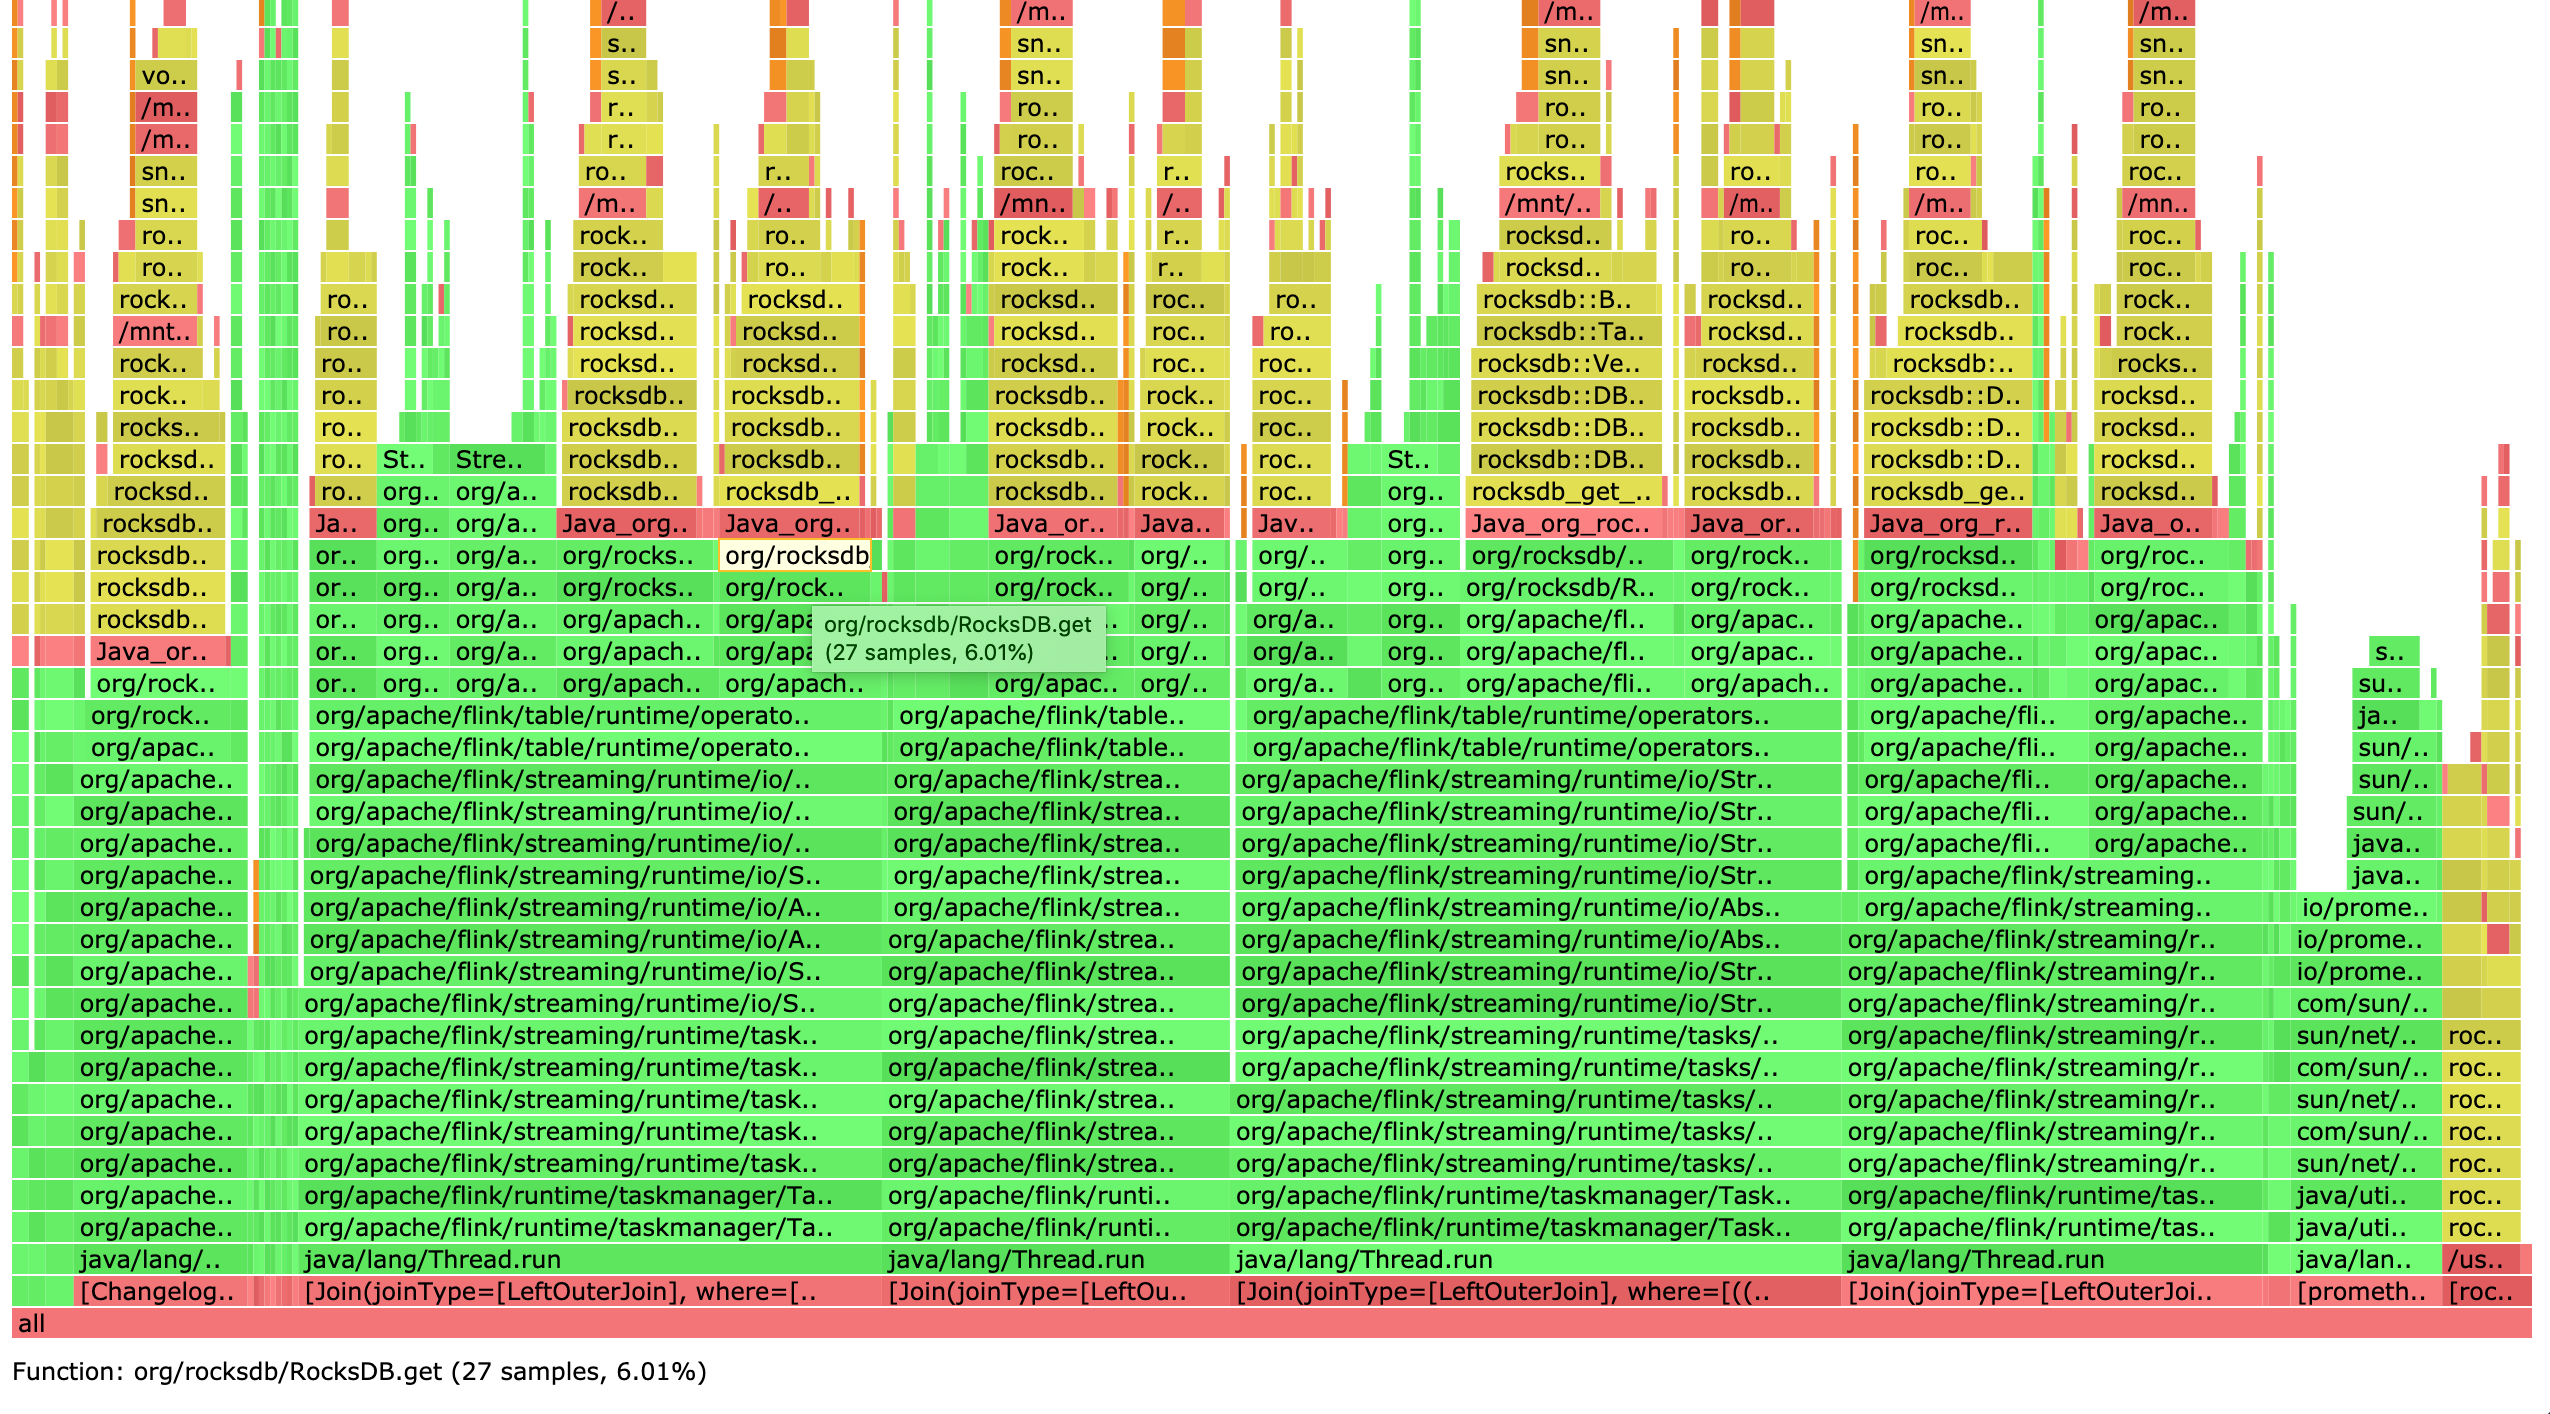
Hi Till, Thank you for the suggestion, the phenomenon is that the CPU utilization does not always have such pattern. Sometimes it has skewed case as above, while sometimes all CPUs on hosts are evenly utilized. For the skewed case, I did a profiling with async-profiler, it does not have specific hotspot, almost all of the time is spend on rocksdb accessing as with normal cases as shown below.  On Fri, Apr 9, 2021 at 1:13 AM Till Rohrmann <[hidden email]> wrote:
Best wishes, - Kai |
«
Return to (DEPRECATED) Apache Flink User Mailing List archive.
|
1 view|%1 views
| Free forum by Nabble | Edit this page |


