Setting source vs sink vs window parallelism with data increase
Setting source vs sink vs window parallelism with data increase
|
Hi all, I'm trying to process many records, and I have an expensive operation I'm trying to optimize. Simplified it is something like: Data: (key1, count, time) Source -> Map(x -> (x, newKeyList(x.key1)) -> Flatmap(x -> x._2.map(y => (y, x._1.count, x._1.time)) -> Keyby(_.key1).TublingWindow().apply.. -> Sink In the Map -> Flatmap, what is happening is that each key is mapping to a set of keys, and then this is set as the new key. This effectively increase the size of the stream by 16x What I am trying to figure out is how to set the parallelism of my operators. I see in some comments that people suggest your source, sink and aggregation should have different parallelism, but I'm not clear on exactly why, or what this means for CPU utilization. (see for example https://stackoverflow.com/questions/48317438/unable-to-achieve-high-cpu-utilization-with-flink-and-gelly) Also, it isn't clear to me the best way to handle this increase in data within the stream itself. Thanks |
Re: Setting source vs sink vs window parallelism with data increase
|
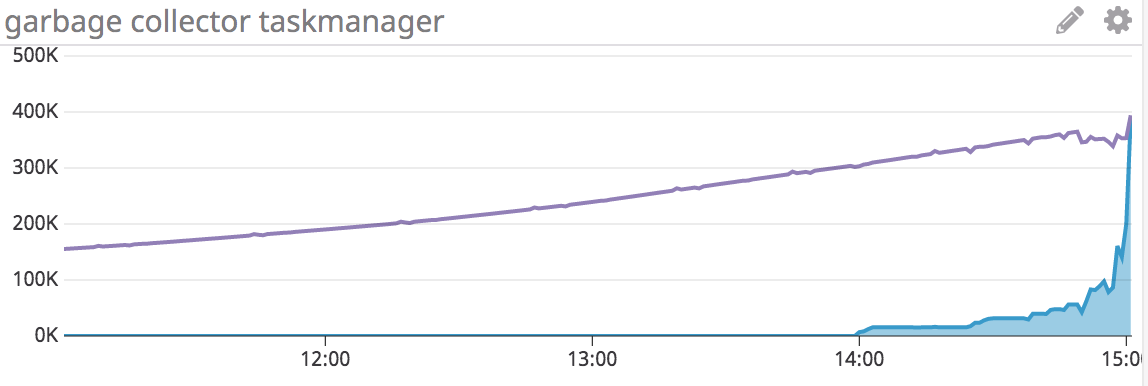
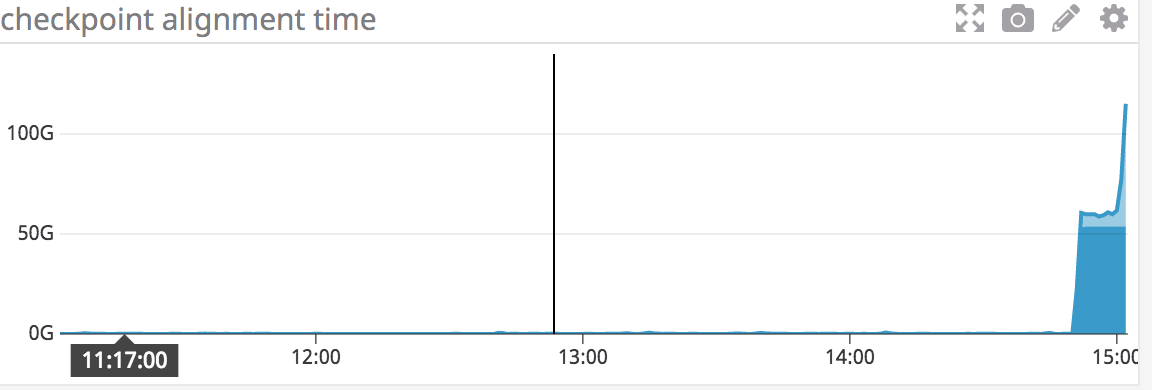
Hi all again - following up on this I think I've identified my problem as being something else, but would appreciate if anyone can offer advice. After running my stream from sometime, I see that my garbage collector for old generation starts to take a very long time:  here the purple line is young generation time, this is ever increasing, but grows slowly, while the blue is old generation. This in itself is not a problem, but as soon as the next checkpoint is triggered after this happens you see the following:  It looks like the checkpoint hits a cap, but this is only because the checkpoints start to timeout and fail (these are the alignment time per operator) I do notice that my state is growing quite larger over time, but I don't have a good understanding of what would cause this to happen with the JVM old generation metric, which appears to be the leading metric before a problem is noticed. Other metrics such as network buffers also show that at the checkpoint time things start to go haywire and the situation never recovers. Thanks On Thu, Feb 28, 2019 at 5:50 PM Padarn Wilson <[hidden email]> wrote:
|
Re: Setting source vs sink vs window parallelism with data increase
|
Hi,
What Flink version are you using? Generally speaking Flink might not the best if you have records fan out, this may significantly increase checkpointing time. However you might want to first identify what’s causing long GC times. If there are long GC pause, this should be the first thing to fix. Piotrek
|
Re: Setting source vs sink vs window parallelism with data increase
|
Re-adding user mailing list.
Hi, If it is a GC issue, only GC logs or some JVM memory profilers (like Oracle’s Mission Control) can lead you to the solution. Once you confirm that it’s a GC issue, there are numerous resources online how to analyse the cause of the problem. For that, it is difficult to use CPU profiling/Flink Metrics, since GC issues caused by one thread, can cause performance bottlenecks in other unrelated places. If that’s not a GC issue, you can use Flink metrics (like number of buffered input/output data) to find Task that’s causing a bottleneck. Then you can use CPU profiler to analyse why is that happening. Piotrek
|
Re: Setting source vs sink vs window parallelism with data increase
|
Thanks a lot for your suggestion. I’ll dig into it and update for the mailing list if I find anything useful. Padarn On Wed, 6 Mar 2019 at 6:03 PM, Piotr Nowojski <[hidden email]> wrote:
|
Re: Setting source vs sink vs window parallelism with data increase
|
Well.. it turned out I was registering millions of timers by accident, which was why garbage collection was blowing up. Oops. Thanks for your help again. On Wed, Mar 6, 2019 at 9:44 PM Padarn Wilson <[hidden email]> wrote:
|
Re: Setting source vs sink vs window parallelism with data increase
|
No problem and it’s good to hear that you managed to solve the problem.
Piotrek
|
«
Return to (DEPRECATED) Apache Flink User Mailing List archive.
|
1 view|%1 views
| Free forum by Nabble | Edit this page |

