Re: flink operator's latency metrics continues to increase.
Re: flink operator's latency metrics continues to increase.
|
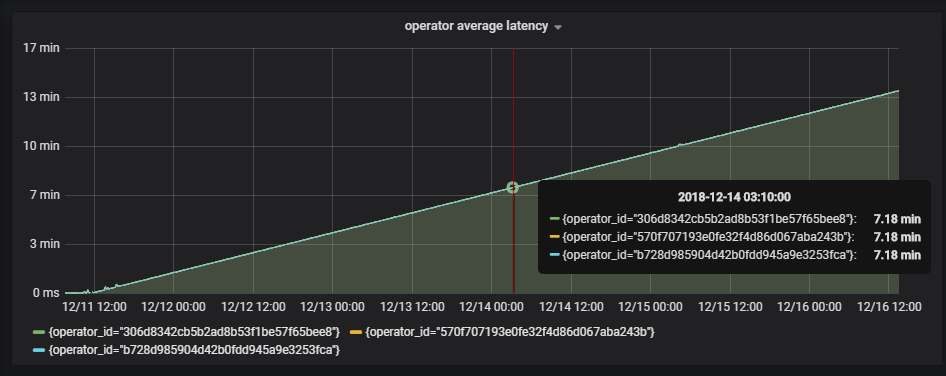
Hi Suxing Lee, thanks for reaching out to me. I forward this mail also to the user mailing list because it could be interesting for others as well. Your observation could indeed be an indicator for a problem with the latency metric. I quickly checked the code and on the first glance it looks right to me that we increase the nextTimestamp field by period in RepeatedTriggerTask because we schedule this task at a fixed rate in SystemProcessingTimeService#scheduleAtFixedRate. Internally this method calls ScheduledThreadPoolExecutor#scheduleAtFixedRate which uses System.nanoTime to schedule tasks repeatedly. In fact, the same logic will be used by the ScheduledThreadPoolExecutor#ScheduledFutureTask. If a GC pause or another stop the world event happens, this should only affect one latency metric and not all (given that System.nanoTime continues to increase) because the next will be scheduled faster since System.nanoTime might have progressed more. What could be a problem is that we compute the latency by System.currentTimeMillis - marker.getMarkedTime. I think there is no guarantee that System.currentTimeMillis and System.nanoTime don't drift apart. Especially if they are executed on different machines. This is something which we could check. This link [1] explains the drift problem a bit more in detail. In any case, I would suggest to open a JIRA issue to report this problem. Cheers, Till On Mon, Dec 17, 2018 at 2:37 PM Suxing Lee <[hidden email]> wrote:
|
«
Return to (DEPRECATED) Apache Flink User Mailing List archive.
|
1 view|%1 views
| Free forum by Nabble | Edit this page |


