Quick survey on checkpointing performance
Quick survey on checkpointing performance
|
Hi all,
We are currently experiencing long checkpointing times on S3 and are wondering how abnormal it is compared to other loads and setups. Could some of you share a few stats in your running architecture so we can compare? Here are our stats: Architecture: 28 TM on Kubernetes, 4 slots per TM, local NVME SSDs (r5d.2xlarge instances), RocksDB state backend, incremental checkpoints on Amazon S3 (without entropy injection), checkpoint interval of 1 hour Typical state size for one checkpoint: 220gb Checkpointing duration (End to End): 58 minutes We are surprised to see such a long duration to send 220gb to S3, we observe no backpressure in our job and the checkpointing duration is more or less the same for each subtask. We'd love to check if it's a normal duration or not, so thanks a lot for your answers! Cheers, Robin |
|
Hi Robin
First of all, did you get the state size from the web UI? If so, the state size is the incremental checkpoint size not the actual full size [1]. I assume you only have one RocksDB instance per slot, the incremental checkpoint size for each RocksDB instance
is 2011MB, which is some
how quite large as an incremental size.
If every operator would only upload 2011MB to S3, the overall time of 58min is really too large. Would you please check the async phase of your checkpoint details of all tasks. The async time would reflect the S3 performance for writing data. I guess your async
time would not be too large, the most common reason is operator receiving the barrier late which lead to the end-to-end duration large. I hope you could offer the UI of your checkpoint details for further investigation.
Best
Yun Tang
From: Robin Cassan <[hidden email]>
Sent: Wednesday, April 15, 2020 18:35 To: user <[hidden email]> Subject: Quick survey on checkpointing performance Hi all,
We are currently experiencing long checkpointing times on S3 and are wondering how abnormal it is compared to other loads and setups. Could some of you share a few stats in your running architecture so we can compare?
Here are our stats: Architecture: 28 TM on Kubernetes, 4 slots per TM, local NVME SSDs (r5d.2xlarge instances), RocksDB state backend, incremental checkpoints on Amazon S3 (without entropy injection), checkpoint interval of 1 hour Typical state size for one checkpoint: 220gb Checkpointing duration (End to End): 58 minutes We are surprised to see such a long duration to send 220gb to S3, we observe no backpressure in our job and the checkpointing duration is more or less the same for each subtask. We'd love to check if it's a normal duration or not, so thanks a lot for your answers! Cheers, Robin |
Re: Quick survey on checkpointing performance
|
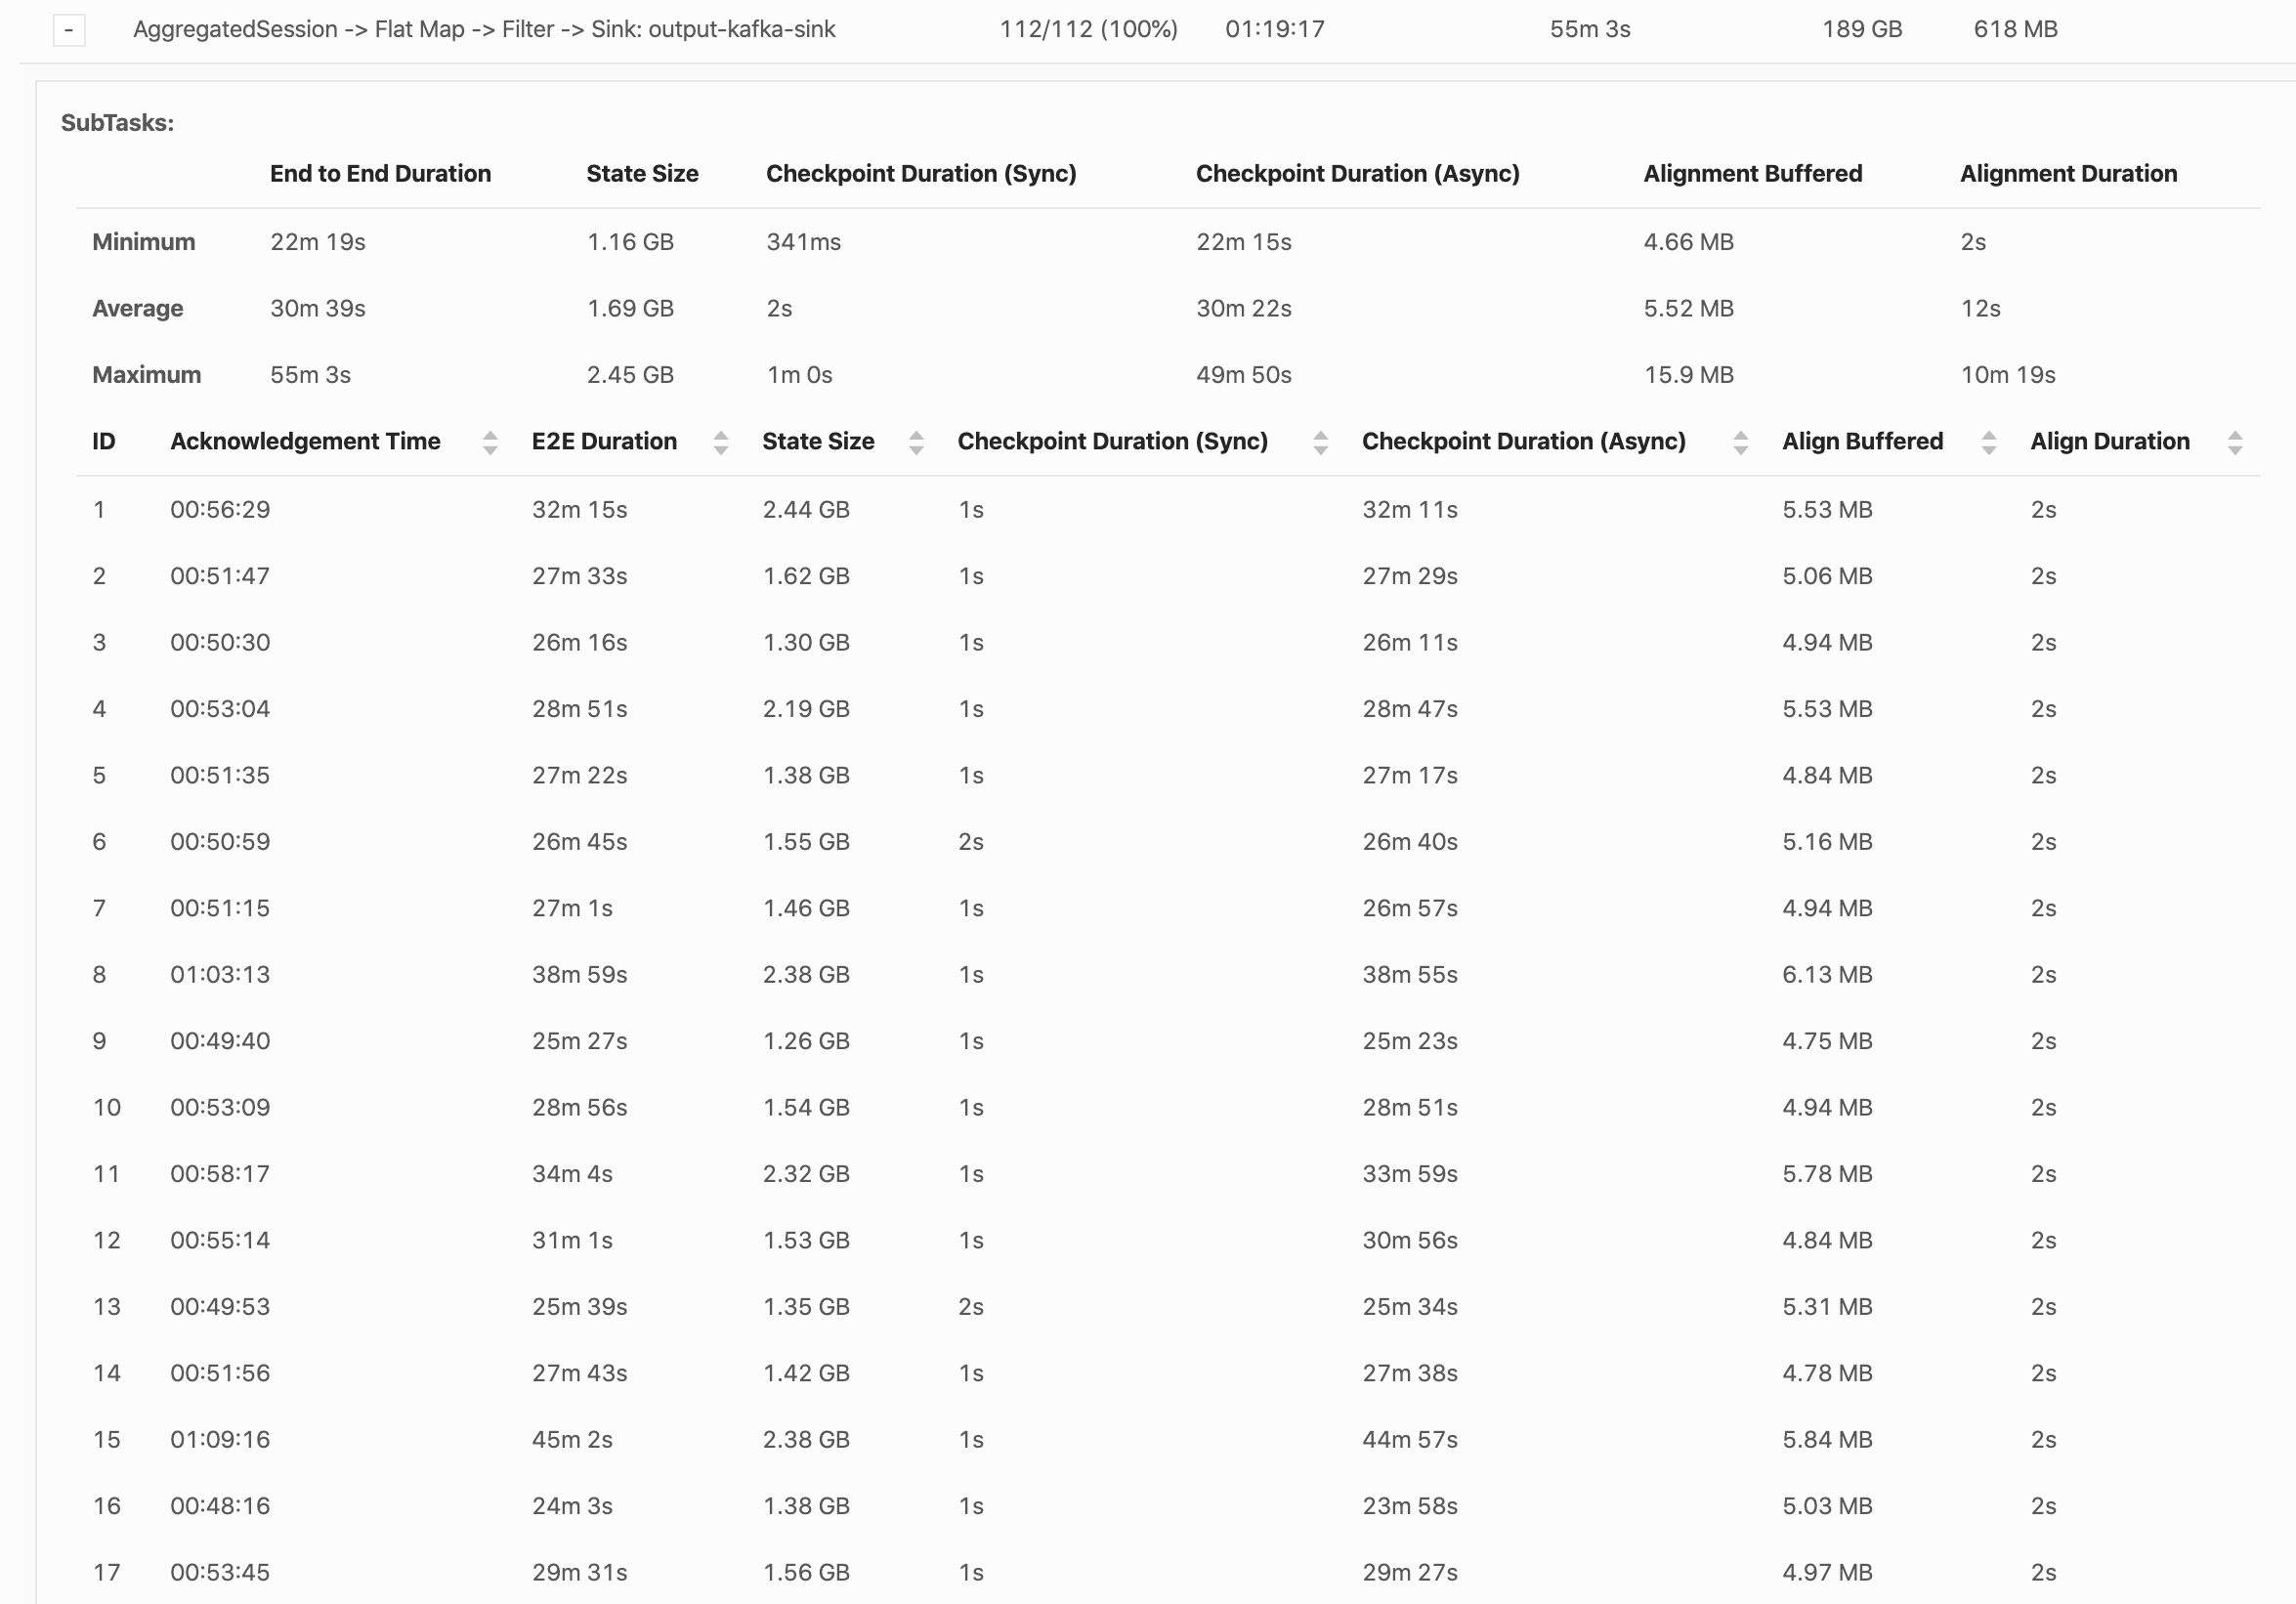
Hi Yun, Thank you for answering! For clarification, the 220Gb size was indeed the size of one incremental checkpoint for all subtasks, as shown by the web UI. Since this operator has 122 partitions, this would mean that each RocksDB instance is sending 1.8Gb to S3, if I'm not mistaken, which should take less than one hour I agree... We do not really see delays in the alignment phase, most of the time is spent in the Async phase, as shown in the screenshot below. Does the Async phase only include sending sst files to S3 or does it also do other operations, like RocksDB flushing or merging? Here is an example of a long Async duration:  The longest subtask is the number 46:  Do you think our bottleneck could be network or disk throughput? Thanks again! Robin Le mer. 15 avr. 2020 à 15:56, Yun Tang <[hidden email]> a écrit :
|
|
Hi Robin
The async phase would only include uploading sst files to S3, the time of RocksDB flushing to local disk is included in the sync phase. From my point of view, uploading only 1GB files with duration of 20min is really slow. Could you check the status of S3 to
see the metrics of network or disk throughput, and logs within taskmanager might also contain some warnings if they write to S3 slow due to some timeout exception.
Best
Yun Tang
From: Robin Cassan <[hidden email]>
Sent: Thursday, April 16, 2020 7:33 To: Yun Tang <[hidden email]> Cc: user <[hidden email]> Subject: Re: Quick survey on checkpointing performance Hi Yun,
Thank you for answering! For clarification, the 220Gb size was indeed the size of one incremental checkpoint for all subtasks, as shown by the web UI. Since this operator has 122 partitions, this would mean that each RocksDB instance is sending 1.8Gb to S3, if I'm not mistaken, which should take less than one hour I agree... We do not really see delays in the alignment phase, most of the time is spent in the Async phase, as shown in the screenshot below. Does the Async phase only include sending sst files to S3 or does it also do other operations, like RocksDB flushing or merging? Here is an example of a long Async duration:  The longest subtask is the number 46:
 Do you think our bottleneck could be network or disk throughput?
Thanks again! Robin Le mer. 15 avr. 2020 à 15:56, Yun Tang <[hidden email]> a écrit :
|
«
Return to (DEPRECATED) Apache Flink User Mailing List archive.
|
1 view|%1 views
| Free forum by Nabble | Edit this page |

