Memory reclaim problem on Flink Kubernetes pods

Memory reclaim problem on Flink Kubernetes pods

|
Hi Team,
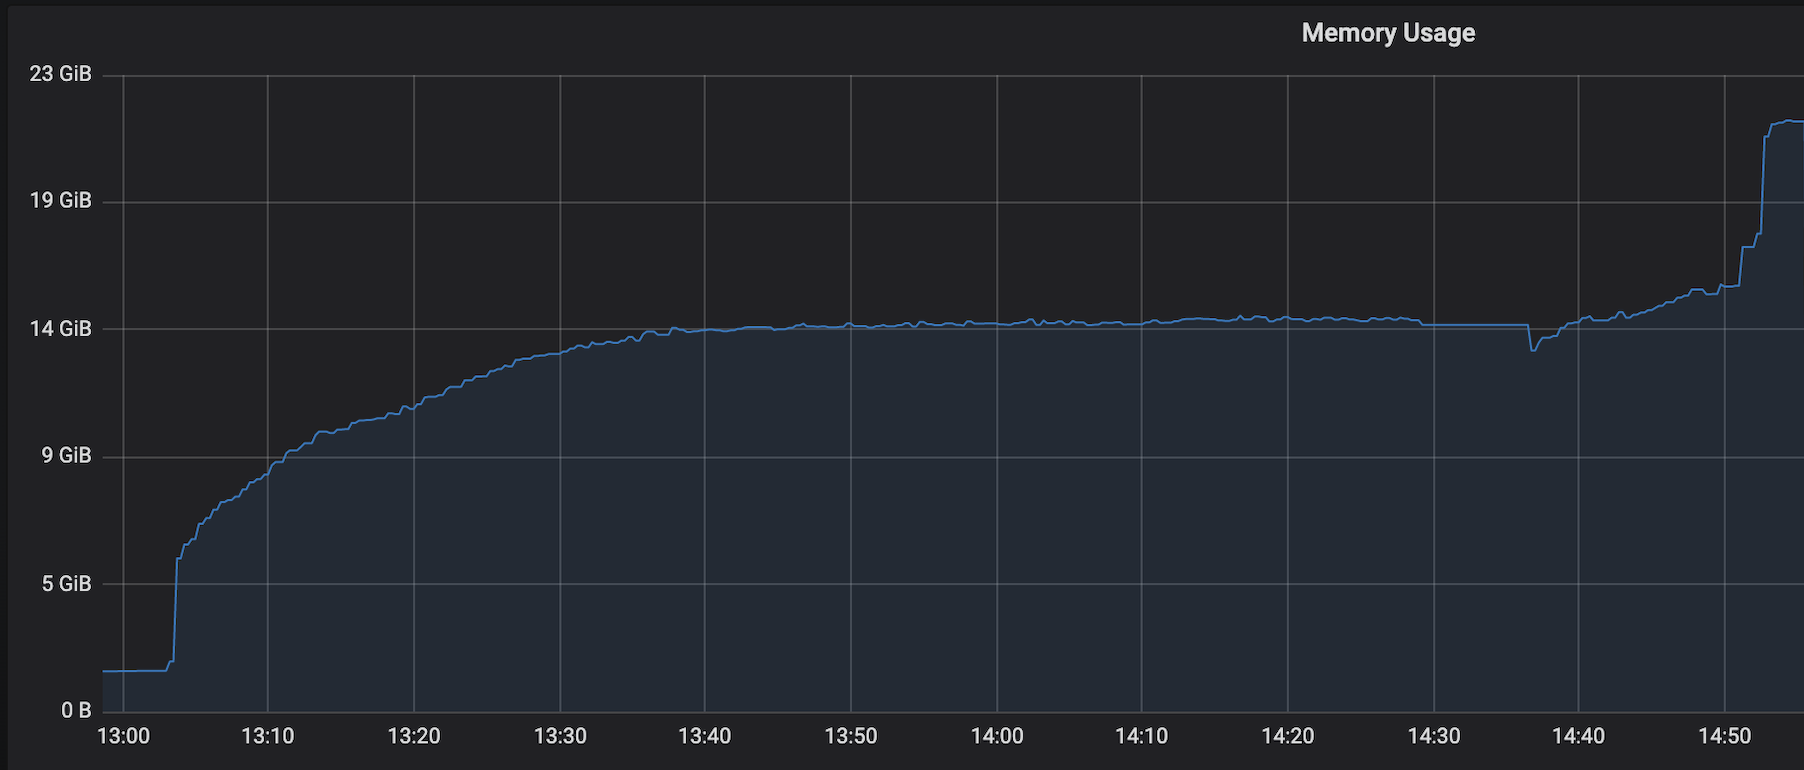
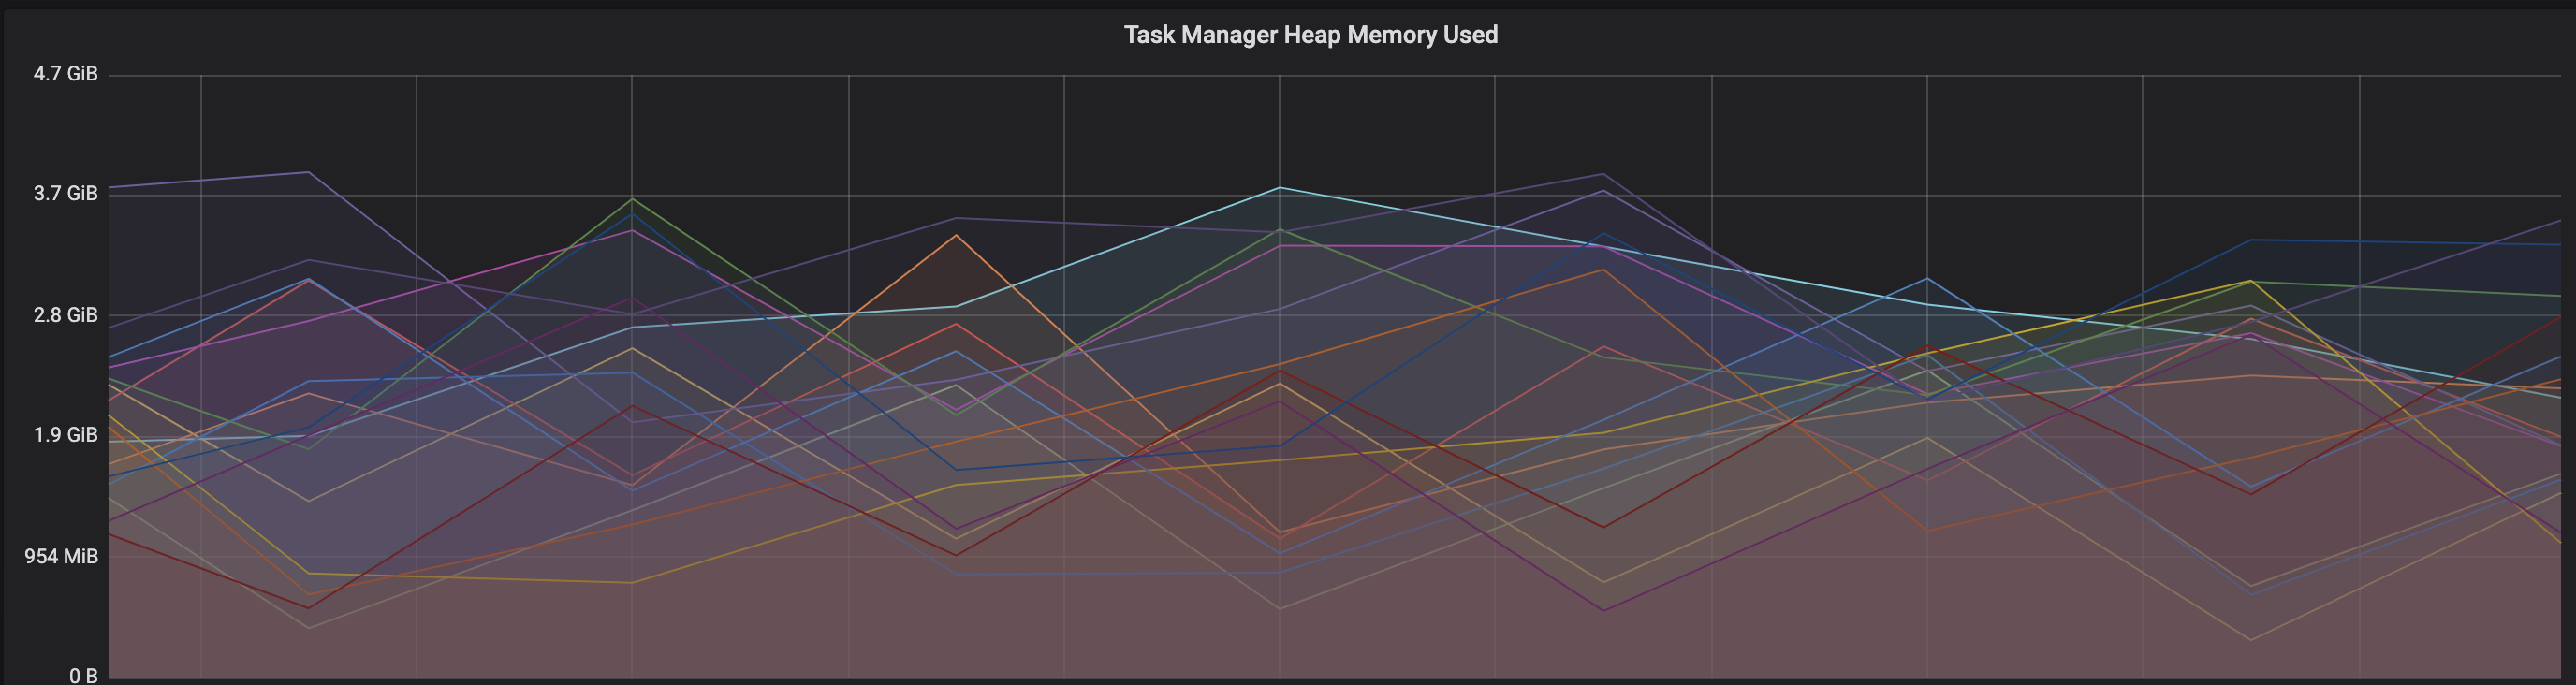
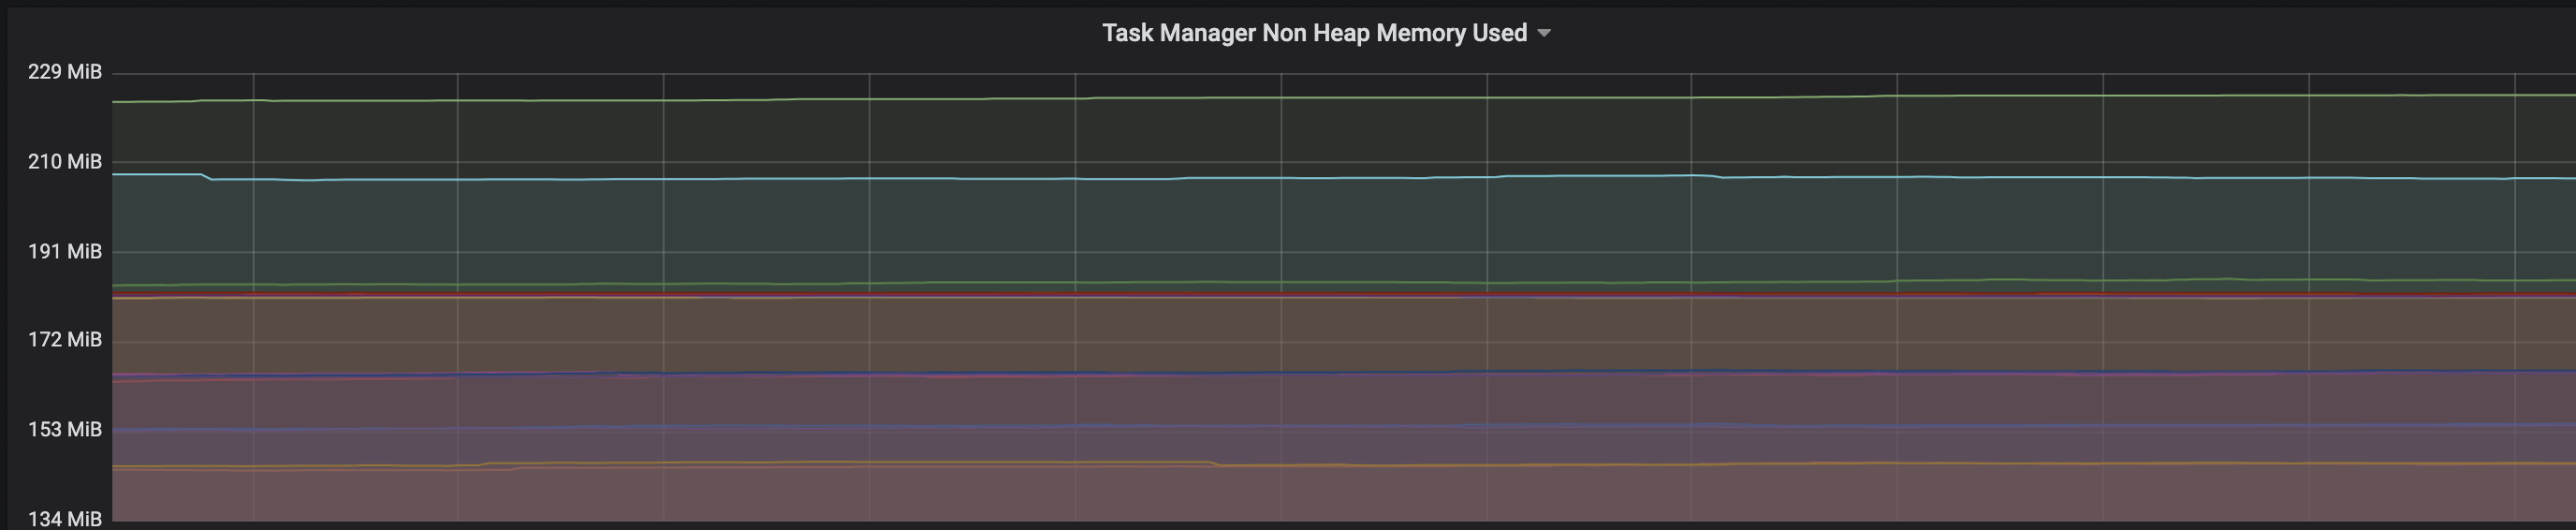
We are facing an issue where the memory is not reclaimed after the job is cancelled on the K8 session cluster, the pods were entirely used by a single job only. So, after re-submitting the same job it fails immediately. We are using RocksDb state backend where the state size is fairly small ranging from 800MB to 1GB. Cluster Configurations: Flink 1.10.1 version 8 TM pods with 4 slots each and 16Gb per pod. Memory Fraction ratio : 0.6 Few Observations/Concerns: 1.I have observed a weird issue where the memory usage goes beyond 16Gb for the pod , attaching a screenshot in-line.  2. Plotted a graph for `flink_taskmanager_Status_JVM_Memory_NonHeap_Used` and it is under 300MB per pod  3. We thought if there is any memory leak that is causing this to happen but there is normal GC activity going on and TM heap usage is under control  Am I missing any obvious configuration to be set ? Regards, Vinay Patil |
Re: Memory reclaim problem on Flink Kubernetes pods
|
|
Hi, Can someone please help here , is it expected that the memory will not go down even after the job is killed. We always have to restart the pods because of this issue. Since the state size is under 1Gb , I will try with FSStatebackend. But I want to understand why this is the case - I had faced the same issue earlier on YARN - https://issues.apache.org/jira/browse/FLINK-7289 which is fixed in version 1.10 Regards, Vinay Patil On Wed, Jul 29, 2020 at 6:55 PM Vinay Patil <[hidden email]> wrote:
|


Re: Memory reclaim problem on Flink Kubernetes pods
|
|
Hi, We are facing a similar issue in Yarn even with Flink 1.10, the only workaround we have figured is to kill the YARN session before restarting the job. ~Akshay On Thu, Jul 30, 2020 at 2:55 PM Vinay Patil <[hidden email]> wrote:
|


Re: Memory reclaim problem on Flink Kubernetes pods
|
|
Hi Vinay and Akshay, could you share the logs of the cluster with us? Ideally on DEBUG level if possible. This would help to debug the problem. Have you tried whether the same problem occurs with Flink 1.11.1 as well? Cheers, Till On Thu, Jul 30, 2020 at 11:30 AM Akshay Aggarwal <[hidden email]> wrote:
|


Re: Memory reclaim problem on Flink Kubernetes pods
|
|
Hi Till, Sure, I will share the logs with you once I run in preprod env. In prod, we are able to reproduce it always. For now we have shifted to FSStateBackend as the state size is under 1GB. > Have you tried whether the same problem occurs with Flink 1.11.1 as well No, will give it a try in preprod env. Regards, Vinay Patil On Thu, Jul 30, 2020 at 3:10 PM Till Rohrmann <[hidden email]> wrote:
|


Re: Memory reclaim problem on Flink Kubernetes pods
|
|
Hi, From my own experience running state-heavy flinks jobs, it's nice to keep an eye on these memory-related things: * metaspace usage. When the job is stopped/cancelled, flink closes the job classloader, which should, in theory, GC all the classes it loaded. But in practice It's quite easy to accidentally leak something to the TM JVM: for example, a thread or metahandle, which will not allow the JVM to unload the classloader. You can make a heap dump and check how many ChildFirstClassLoaders are there and what references are stopping them from being GCed. * rocksdb block cache, which is allocated outside of JVM. There are quite a lot of rocksdb-related metrics exposed by flink (which are AFAIK disabled by default) I suggest enabling a -XX:NativeMemoryTracking=summary for the jvm and monitoring non-heap memory usage. If you see always growing metaspace, then it's a classloader leak. If metaspace is constant, check the difference between process RSS usage and allocated memory reported by NMT: if the difference is too huge, then the leak is happening outside of the JVM, most probably in RocksDB. Roman Grebennikov | [hidden email] On Thu, Jul 30, 2020, at 12:53, Vinay Patil wrote:
|


Re: Memory reclaim problem on Flink Kubernetes pods
|
|
I suspect it's RocksDB memory growth. We also observed same issue with RocksDB but couple of things should limit the growth: 1. Reducing the frequency of state update over a period of time equal to checkpoint interval 2. By adding couple of intermediate RocksDB internal tuning params: state.backend.rocksdb.compaction.level.use-dynamic-size: truestate.backend.rocksdb.thread.num: 3Increasing the compaction thread count 3. No matter how we do, there will be memory growth with RocksDB because of its consistent File IO and increasing page cache size. That's why in the documentation they clearly mentioned very large states and obviously once we have very large states, we don't write the state very frequently. 4. I feel if we are using RocksDB then we should spend significant amount of time tuning ROcksDB state, otherwise it's not easy. 5. Excellent performance is seen using FsSystemBackend for our same workloads in our benchmarking tests Regards Bhaskar
On Tue, Aug 4, 2020 at 2:21 AM Roman Grebennikov <[hidden email]> wrote:
|


Re: Memory reclaim problem on Flink Kubernetes pods
|
|
Also to eliminate RocksDB issue, can you please try switching to FsSystemBackend and run your tests? If you still see memory growth then it's not because of RocksDB. Regards Bhaskar On Tue, Aug 4, 2020 at 6:23 AM Vijay Bhaskar <[hidden email]> wrote:
|


| Free forum by Nabble | Edit this page |