Memory in CEP queries keep increasing

classic Classic list List threaded Threaded
7 messages Options
Reply | Threaded
Open this post in threaded view
|

Memory in CEP queries keep increasing

Arujit Pradhan
Hi all,

So we were spiking Flink CEP SQLs recently and we find that the state size of our Flink jobs which use pattern matching keep on increasing.

One sample skeleton of our SQL query looks something like this :
SELECT * FROM (
SELECT col1, col2 from TABLE1
LEFT JOIN TABLE2
ON
TABLE1.id = table2.fid
AND
TABLE1.event_time BETWEEN TABLE2.event_time - INTERVAL '5' MINUTE
AND
TABLE2.event_time + INTERVAL '5' MINUTE
) MATCH_RECOGNIZE(
PARTITION BY TABLE1.id
ORDER BY event_time
MEASURES eventA.id
PATTERN (eventA, eventB) within INTERVAL '1' HOUR
DEFINE
eventA as TABLE1='conditionA',
eventB as TABLE2='conditionB'
) AS T

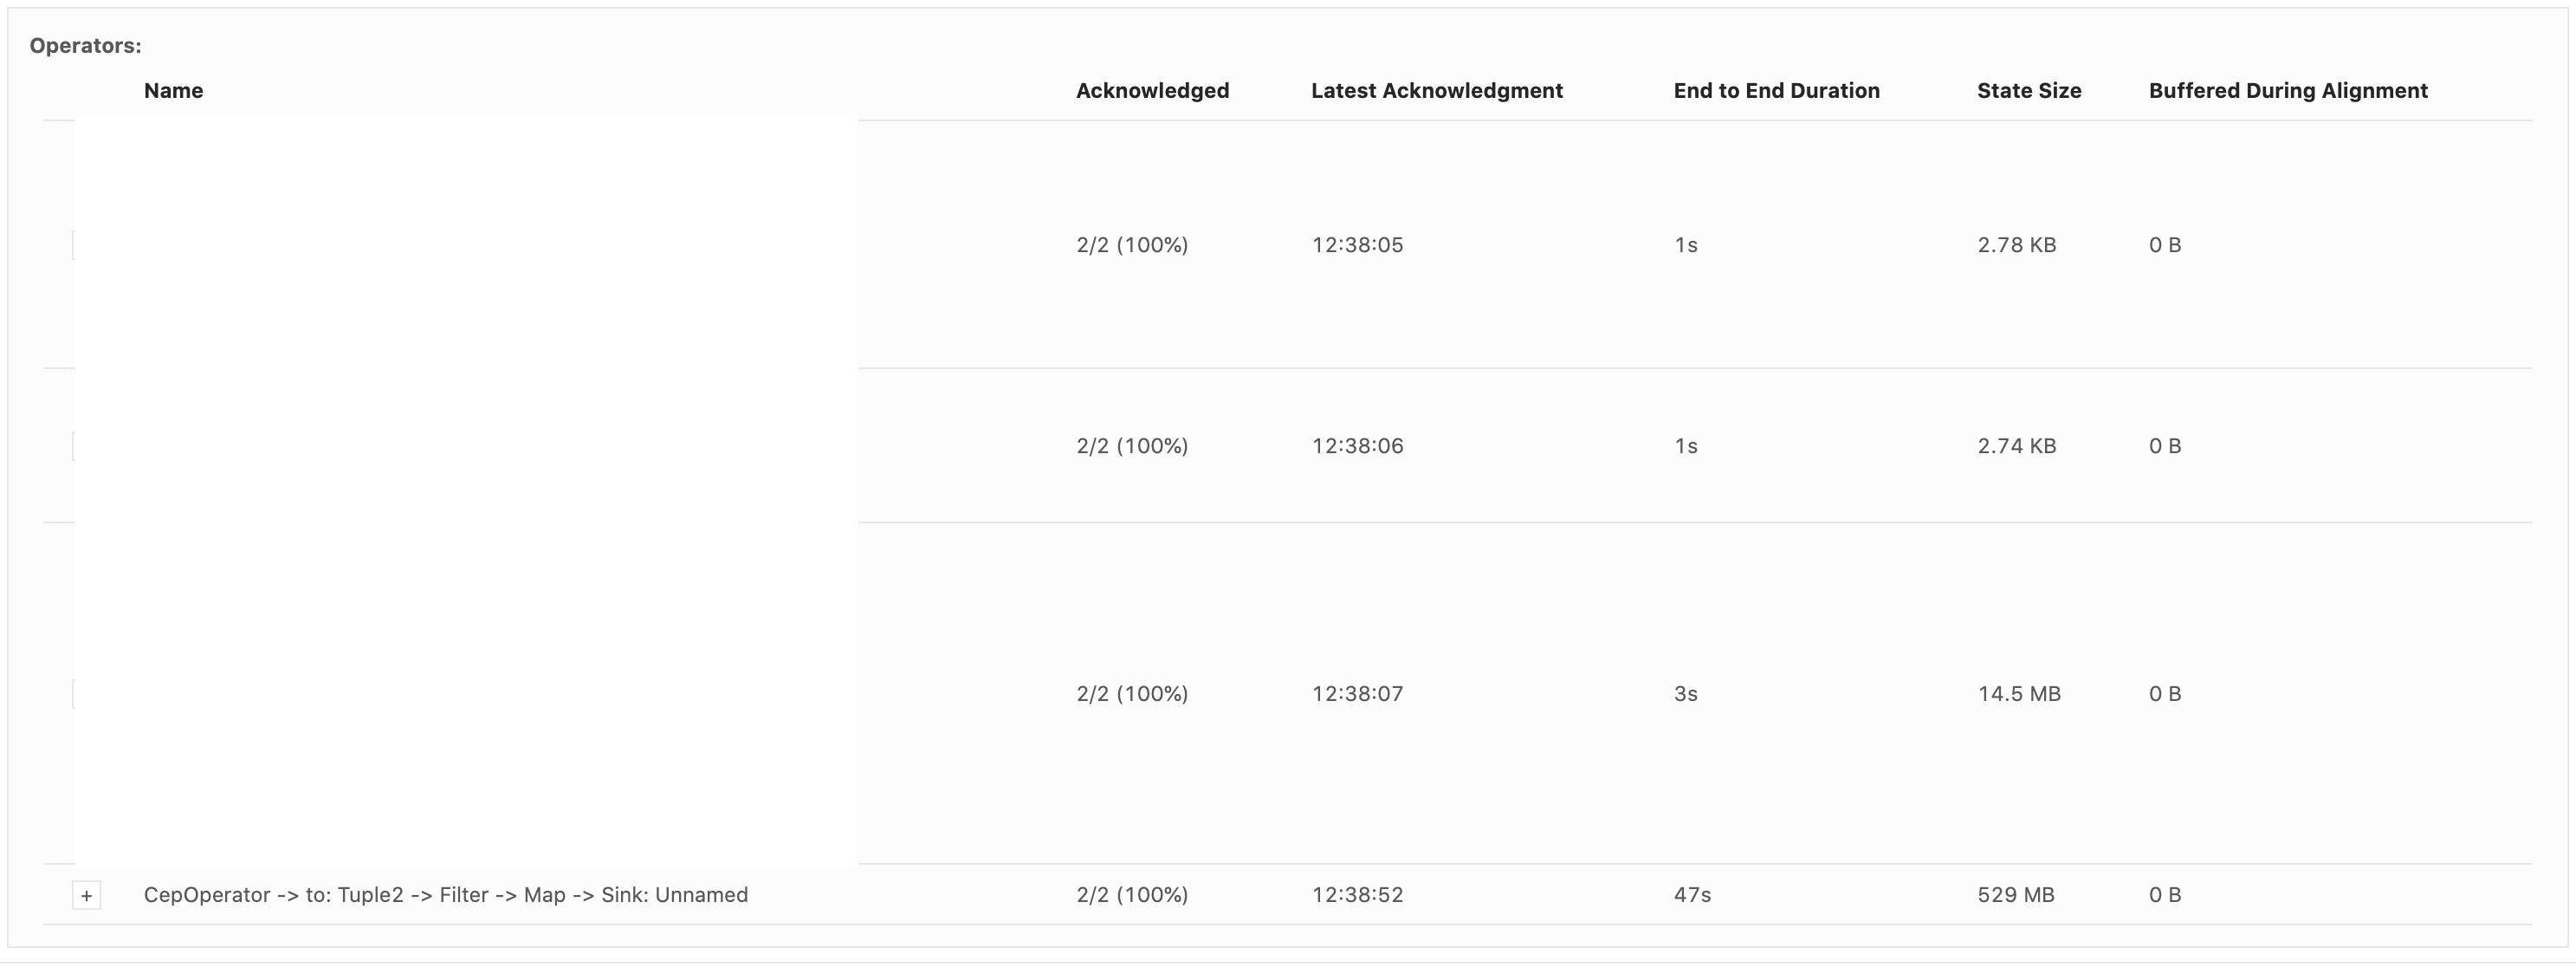
Interestingly the state size of the CEP operator is really high as compared to other stages of the query (Image attached below).
image.png


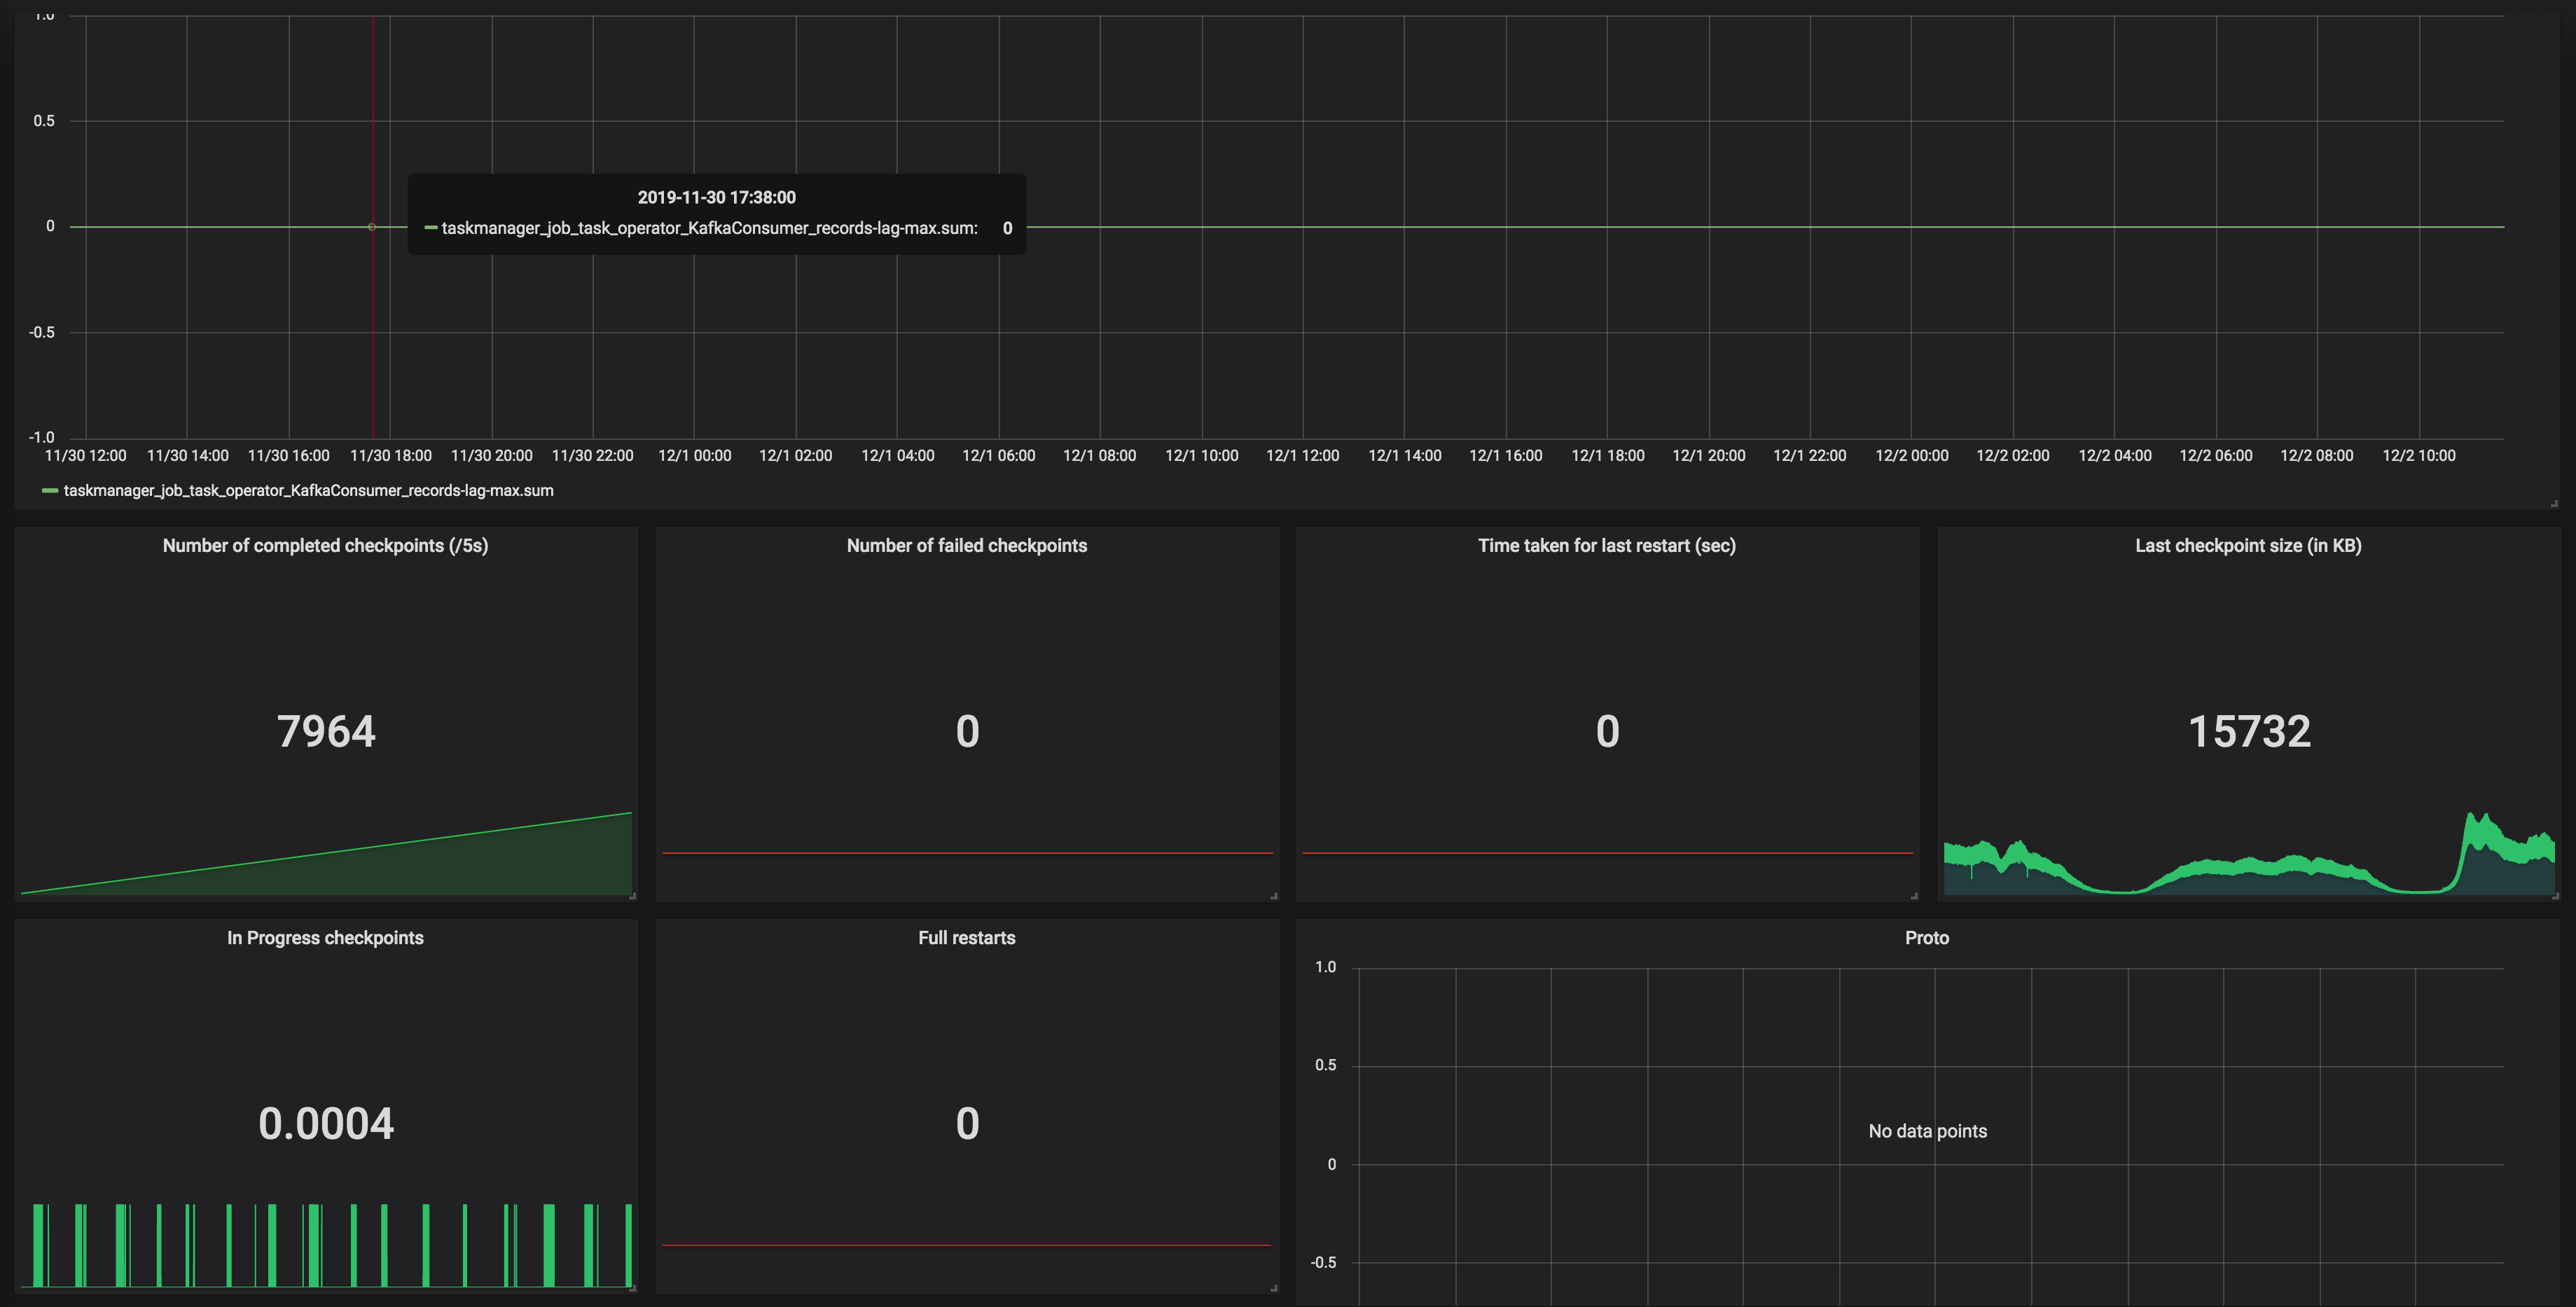
The overall checkpoint size can be found in this metric. In some cases, the state size grows up to GBs and cause out of memory error.
image.png


We are using Flink-1.9, but earlier we were facing this issue even with Flink-1.8. It will be really helpful if you can point out the reason which may be causing this abnormal behaviour.


Thanks and regards,
Arujit.

Reply | Threaded
Open this post in threaded view
|

Re: Memory in CEP queries keep increasing

Dawid Wysakowicz-2

Hi Arujit,

It is hard for me to explain the memory consumption in your queries exactly as I don't know what is the size of your records, input rate, what is the exact query that you are running etc. (is the query you posted actually valid? the eventA as TABLE1='conditionA' looks rather strange).

Let me try to explain a bit though how the CEP operator works and point out some important facts one must take into account when using the MATCH recognize. First of all cep operator needs events to be sorted, as the underlying automaton works on sorted stream. Therefore it will buffer all the records until a watermark arrives and only after that it will feed the records into the automaton. Secondly, in order to evaluate transitions, the automaton keeps records in the state as long as it might need them for evaluating future conditions. For example if you have a simple pattern like A B. When an event that satisfied the condition of A arrives it is put into the state until the next event arrives (if it satisfies the B condition a match is emitted, if not the partial match is invalidated because of the strict continuity) or until the timeout on a match (e.g. 1 hour in the example you showed).

Hope this explanation will help you narrow down your problem. Let me know if something is not clear.

Best,

Dawid

On 18/11/2019 09:42, Arujit Pradhan wrote:
Hi all,

So we were spiking Flink CEP SQLs recently and we find that the state size of our Flink jobs which use pattern matching keep on increasing.

One sample skeleton of our SQL query looks something like this :
SELECT * FROM (
SELECT col1, col2 from TABLE1
LEFT JOIN TABLE2
ON
TABLE1.id = table2.fid
AND
TABLE1.event_time BETWEEN TABLE2.event_time - INTERVAL '5' MINUTE
AND
TABLE2.event_time + INTERVAL '5' MINUTE
) MATCH_RECOGNIZE(
PARTITION BY TABLE1.id
ORDER BY event_time
MEASURES eventA.id
PATTERN (eventA, eventB) within INTERVAL '1' HOUR
DEFINE
eventA as TABLE1='conditionA',
eventB as TABLE2='conditionB'
) AS T

Interestingly the state size of the CEP operator is really high as compared to other stages of the query (Image attached below).
image.png


The overall checkpoint size can be found in this metric. In some cases, the state size grows up to GBs and cause out of memory error.
image.png


We are using Flink-1.9, but earlier we were facing this issue even with Flink-1.8. It will be really helpful if you can point out the reason which may be causing this abnormal behaviour.


Thanks and regards,
Arujit.


signature.asc (849 bytes) Download Attachment
Reply | Threaded
Open this post in threaded view
|

Re: Memory in CEP queries keep increasing

Muhammad Hakim
Hi Dawid,
Thank you for your previous response.
We've been looking for why our state size keeps increasing based on the clue that you gave. We've run a couple of experiments and also try to understand how state is handled in CEP operator.
We notice partial match is handled through something called Shared Versioned Match Buffer. We haven't look into detail implementation of this buffer cleaned up upon timeout or completed.
We ran experiment with 2 kinds of operation. One is Query which has no match at all. Another one is Query which has only one match, and the pattern will never be satisfied. Both of them run using WITHIN '1' MINUTE time.
Following are the query:
-- One Match --
SELECT delivery_id
FROM booking MATCH_RECOGNIZE (
PARTITION BY delivery_id
ORDER BY timestamp
MEASURES
A.delivery_id as delivery_id
MATCH_ROWTIME() AS window_timestamp
AFTER MATCH SKIP PAST LAST ROW
PATTERN (A B C) WITHIN INTERVAL '1' MINUTE
DEFINE
A AS status = 'ON_POST_OFFICE',
B AS status = 'invalid_status_1',
C AS status = 'invalid_status_2'
)

-- No Match --
SELECT delivery_id
FROM booking MATCH_RECOGNIZE (
PARTITION BY delivery_id
ORDER BY timestamp
MEASURES
A.delivery_id as delivery_id
MATCH_ROWTIME() AS window_timestamp
AFTER MATCH SKIP PAST LAST ROW
PATTERN (A B C) WITHIN INTERVAL '1' MINUTE
DEFINE
A AS status = 'invalid_status_1',
B AS status = 'invalid_status_2',
C AS status = 'invalid_status_3'
)

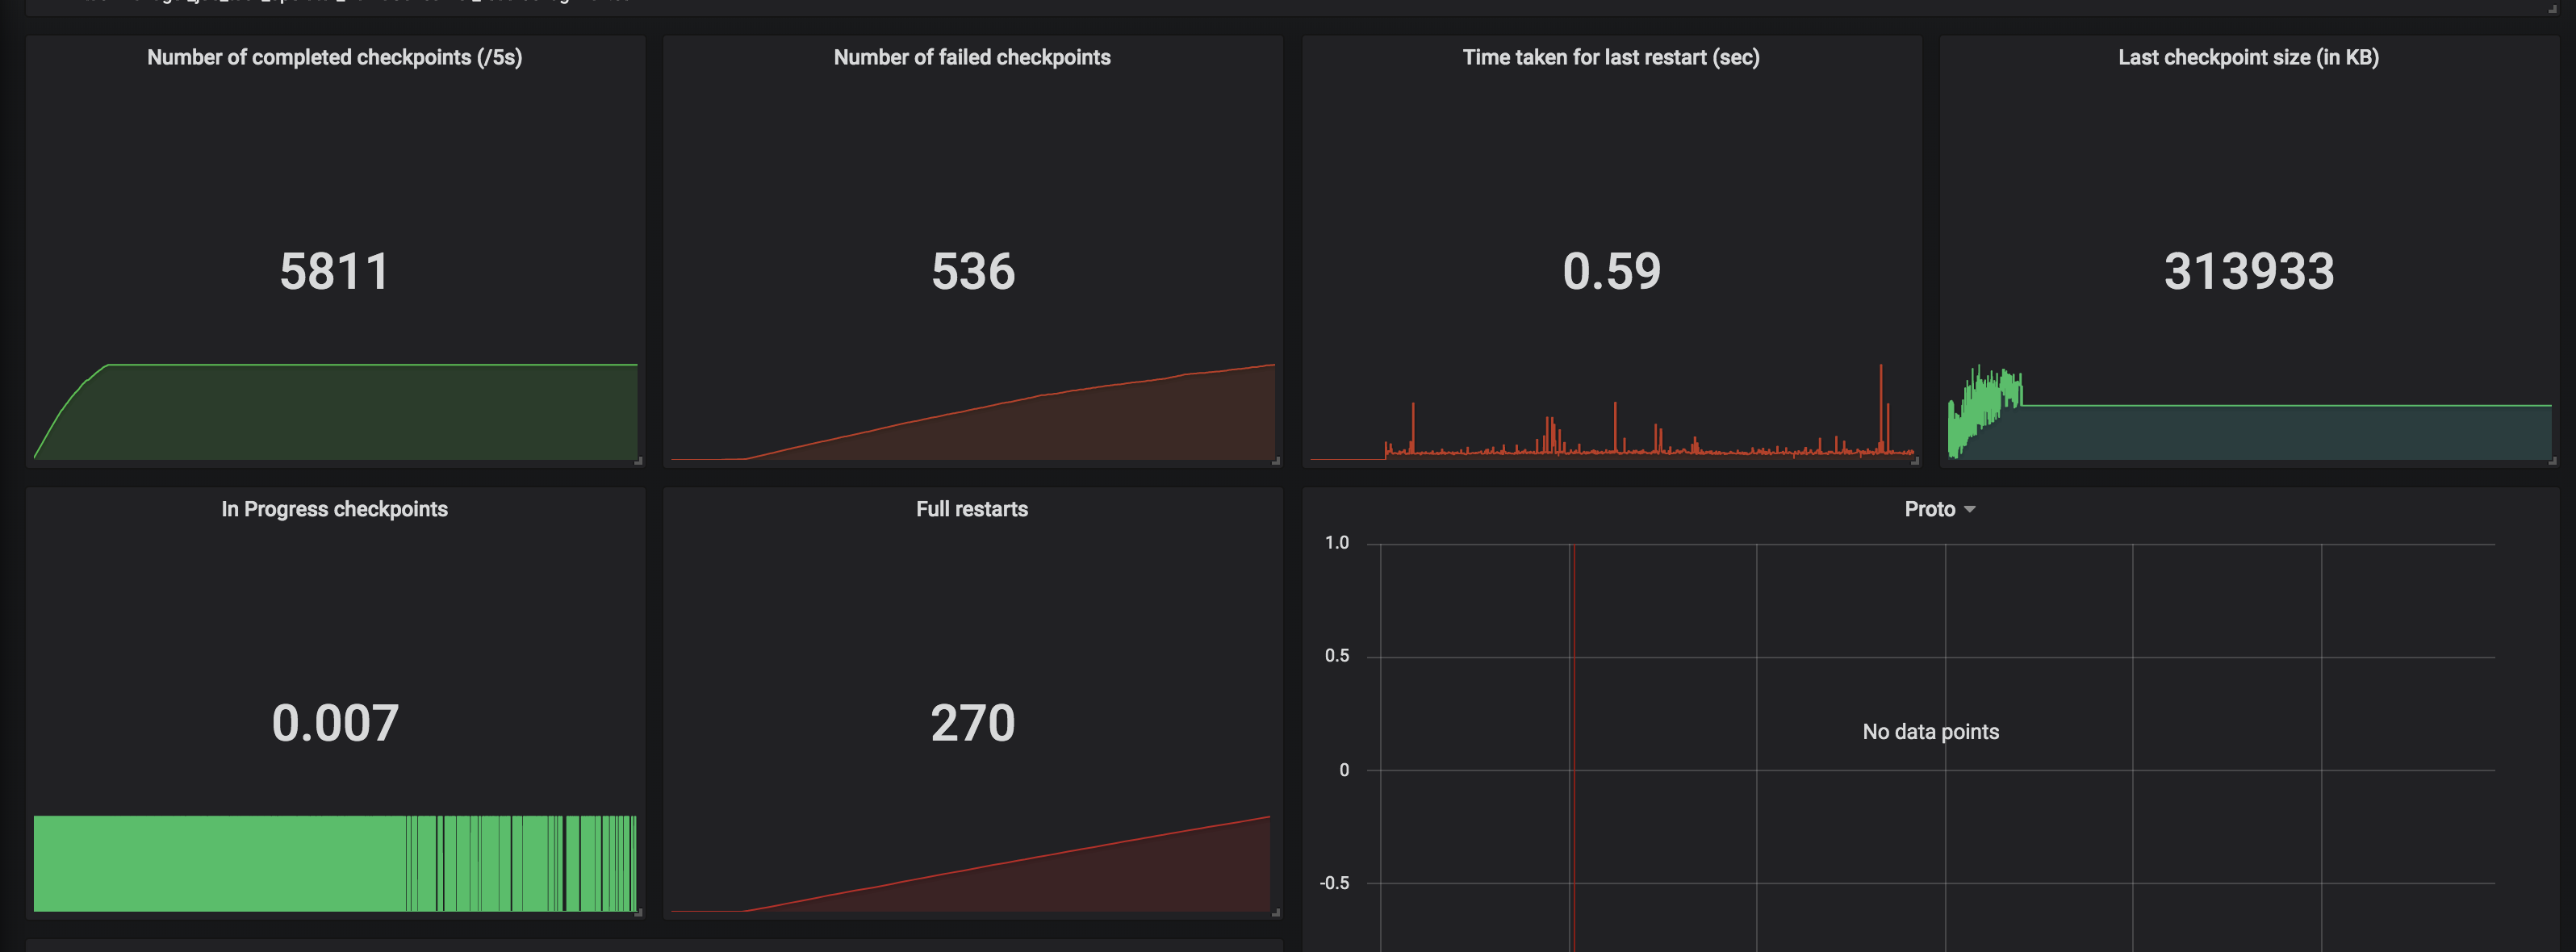
We tracked checkpointed state size and here is the result:
One Partial Match
OneMatchedStats.png
No Match At all
NonMatchedStats.png

From stats that we captured. We got partial match keep increasing until at the point of task manager couldn't handle it and it keeps restarting. While another one that does not have partial match/completed match shown stable memory consumption.
And as Arujit said the one with high memory consumption came from CEP operator. This job only generate two operator in the jobGraph, custom source and CEP operator.

Based on this experiments can you tell us what happened? Does Shared Versioned Match Buffer will keep increasing even usage of within clause? And if it's not what is the expected behaviour upon match timeout?

Your helped previously is much appreciated thank you

On Tue, Nov 19, 2019 at 9:42 PM Dawid Wysakowicz <[hidden email]> wrote:

Hi Arujit,

It is hard for me to explain the memory consumption in your queries exactly as I don't know what is the size of your records, input rate, what is the exact query that you are running etc. (is the query you posted actually valid? the eventA as TABLE1='conditionA' looks rather strange).

Let me try to explain a bit though how the CEP operator works and point out some important facts one must take into account when using the MATCH recognize. First of all cep operator needs events to be sorted, as the underlying automaton works on sorted stream. Therefore it will buffer all the records until a watermark arrives and only after that it will feed the records into the automaton. Secondly, in order to evaluate transitions, the automaton keeps records in the state as long as it might need them for evaluating future conditions. For example if you have a simple pattern like A B. When an event that satisfied the condition of A arrives it is put into the state until the next event arrives (if it satisfies the B condition a match is emitted, if not the partial match is invalidated because of the strict continuity) or until the timeout on a match (e.g. 1 hour in the example you showed).

Hope this explanation will help you narrow down your problem. Let me know if something is not clear.

Best,

Dawid

On 18/11/2019 09:42, Arujit Pradhan wrote:
Hi all,

So we were spiking Flink CEP SQLs recently and we find that the state size of our Flink jobs which use pattern matching keep on increasing.

One sample skeleton of our SQL query looks something like this :
SELECT * FROM (
SELECT col1, col2 from TABLE1
LEFT JOIN TABLE2
ON
TABLE1.id = table2.fid
AND
TABLE1.event_time BETWEEN TABLE2.event_time - INTERVAL '5' MINUTE
AND
TABLE2.event_time + INTERVAL '5' MINUTE
) MATCH_RECOGNIZE(
PARTITION BY TABLE1.id
ORDER BY event_time
MEASURES eventA.id
PATTERN (eventA, eventB) within INTERVAL '1' HOUR
DEFINE
eventA as TABLE1='conditionA',
eventB as TABLE2='conditionB'
) AS T

Interestingly the state size of the CEP operator is really high as compared to other stages of the query (Image attached below).
image.png


The overall checkpoint size can be found in this metric. In some cases, the state size grows up to GBs and cause out of memory error.
image.png


We are using Flink-1.9, but earlier we were facing this issue even with Flink-1.8. It will be really helpful if you can point out the reason which may be causing this abnormal behaviour.


Thanks and regards,
Arujit.

Reply | Threaded
Open this post in threaded view
|

Re: Memory in CEP queries keep increasing

rmetzger0
Hey,
can you share some details on the data you are processing?
Number of records per second, size per record, number of unique delivery_id's and how the watermark is computed?
Which statebackend are you using? (if it is memory based: how much memory do you have per TaskManager?) 

Thanks!


On Mon, Dec 2, 2019 at 11:10 AM Muhammad Hakim <[hidden email]> wrote:
Hi Dawid,
Thank you for your previous response.
We've been looking for why our state size keeps increasing based on the clue that you gave. We've run a couple of experiments and also try to understand how state is handled in CEP operator.
We notice partial match is handled through something called Shared Versioned Match Buffer. We haven't look into detail implementation of this buffer cleaned up upon timeout or completed.
We ran experiment with 2 kinds of operation. One is Query which has no match at all. Another one is Query which has only one match, and the pattern will never be satisfied. Both of them run using WITHIN '1' MINUTE time.
Following are the query:
-- One Match --
SELECT delivery_id
FROM booking MATCH_RECOGNIZE (
PARTITION BY delivery_id
ORDER BY timestamp
MEASURES
A.delivery_id as delivery_id
MATCH_ROWTIME() AS window_timestamp
AFTER MATCH SKIP PAST LAST ROW
PATTERN (A B C) WITHIN INTERVAL '1' MINUTE
DEFINE
A AS status = 'ON_POST_OFFICE',
B AS status = 'invalid_status_1',
C AS status = 'invalid_status_2'
)

-- No Match --
SELECT delivery_id
FROM booking MATCH_RECOGNIZE (
PARTITION BY delivery_id
ORDER BY timestamp
MEASURES
A.delivery_id as delivery_id
MATCH_ROWTIME() AS window_timestamp
AFTER MATCH SKIP PAST LAST ROW
PATTERN (A B C) WITHIN INTERVAL '1' MINUTE
DEFINE
A AS status = 'invalid_status_1',
B AS status = 'invalid_status_2',
C AS status = 'invalid_status_3'
)

We tracked checkpointed state size and here is the result:
One Partial Match
OneMatchedStats.png
No Match At all
NonMatchedStats.png

From stats that we captured. We got partial match keep increasing until at the point of task manager couldn't handle it and it keeps restarting. While another one that does not have partial match/completed match shown stable memory consumption.
And as Arujit said the one with high memory consumption came from CEP operator. This job only generate two operator in the jobGraph, custom source and CEP operator.

Based on this experiments can you tell us what happened? Does Shared Versioned Match Buffer will keep increasing even usage of within clause? And if it's not what is the expected behaviour upon match timeout?

Your helped previously is much appreciated thank you

On Tue, Nov 19, 2019 at 9:42 PM Dawid Wysakowicz <[hidden email]> wrote:

Hi Arujit,

It is hard for me to explain the memory consumption in your queries exactly as I don't know what is the size of your records, input rate, what is the exact query that you are running etc. (is the query you posted actually valid? the eventA as TABLE1='conditionA' looks rather strange).

Let me try to explain a bit though how the CEP operator works and point out some important facts one must take into account when using the MATCH recognize. First of all cep operator needs events to be sorted, as the underlying automaton works on sorted stream. Therefore it will buffer all the records until a watermark arrives and only after that it will feed the records into the automaton. Secondly, in order to evaluate transitions, the automaton keeps records in the state as long as it might need them for evaluating future conditions. For example if you have a simple pattern like A B. When an event that satisfied the condition of A arrives it is put into the state until the next event arrives (if it satisfies the B condition a match is emitted, if not the partial match is invalidated because of the strict continuity) or until the timeout on a match (e.g. 1 hour in the example you showed).

Hope this explanation will help you narrow down your problem. Let me know if something is not clear.

Best,

Dawid

On 18/11/2019 09:42, Arujit Pradhan wrote:
Hi all,

So we were spiking Flink CEP SQLs recently and we find that the state size of our Flink jobs which use pattern matching keep on increasing.

One sample skeleton of our SQL query looks something like this :
SELECT * FROM (
SELECT col1, col2 from TABLE1
LEFT JOIN TABLE2
ON
TABLE1.id = table2.fid
AND
TABLE1.event_time BETWEEN TABLE2.event_time - INTERVAL '5' MINUTE
AND
TABLE2.event_time + INTERVAL '5' MINUTE
) MATCH_RECOGNIZE(
PARTITION BY TABLE1.id
ORDER BY event_time
MEASURES eventA.id
PATTERN (eventA, eventB) within INTERVAL '1' HOUR
DEFINE
eventA as TABLE1='conditionA',
eventB as TABLE2='conditionB'
) AS T

Interestingly the state size of the CEP operator is really high as compared to other stages of the query (Image attached below).
image.png


The overall checkpoint size can be found in this metric. In some cases, the state size grows up to GBs and cause out of memory error.
image.png


We are using Flink-1.9, but earlier we were facing this issue even with Flink-1.8. It will be really helpful if you can point out the reason which may be causing this abnormal behaviour.


Thanks and regards,
Arujit.

Reply | Threaded
Open this post in threaded view
|

Re: Memory in CEP queries keep increasing

Dawid Wysakowicz-2
In reply to this post by Muhammad Hakim

Hi,

Sorry I have not responded yet. We are close to the feature freeze which is scheduled to happen on the 8th December which means we are busy with finishing some of the features. I will definitely have a look at your problem as soon as I find a bit of time for it.

Sorry again,

Best,

Dawid

On 02/12/2019 11:09, Muhammad Hakim wrote:
Hi Dawid,
Thank you for your previous response.
We've been looking for why our state size keeps increasing based on the clue that you gave. We've run a couple of experiments and also try to understand how state is handled in CEP operator.
We notice partial match is handled through something called Shared Versioned Match Buffer. We haven't look into detail implementation of this buffer cleaned up upon timeout or completed.
We ran experiment with 2 kinds of operation. One is Query which has no match at all. Another one is Query which has only one match, and the pattern will never be satisfied. Both of them run using WITHIN '1' MINUTE time.
Following are the query:
-- One Match --
SELECT delivery_id
FROM booking MATCH_RECOGNIZE (
PARTITION BY delivery_id
ORDER BY timestamp
MEASURES
A.delivery_id as delivery_id
MATCH_ROWTIME() AS window_timestamp
AFTER MATCH SKIP PAST LAST ROW
PATTERN (A B C) WITHIN INTERVAL '1' MINUTE
DEFINE
A AS status = 'ON_POST_OFFICE',
B AS status = 'invalid_status_1',
C AS status = 'invalid_status_2'
)

-- No Match --
SELECT delivery_id
FROM booking MATCH_RECOGNIZE (
PARTITION BY delivery_id
ORDER BY timestamp
MEASURES
A.delivery_id as delivery_id
MATCH_ROWTIME() AS window_timestamp
AFTER MATCH SKIP PAST LAST ROW
PATTERN (A B C) WITHIN INTERVAL '1' MINUTE
DEFINE
A AS status = 'invalid_status_1',
B AS status = 'invalid_status_2',
C AS status = 'invalid_status_3'
)

We tracked checkpointed state size and here is the result:
One Partial Match
OneMatchedStats.png
No Match At all
NonMatchedStats.png

From stats that we captured. We got partial match keep increasing until at the point of task manager couldn't handle it and it keeps restarting. While another one that does not have partial match/completed match shown stable memory consumption.
And as Arujit said the one with high memory consumption came from CEP operator. This job only generate two operator in the jobGraph, custom source and CEP operator.

Based on this experiments can you tell us what happened? Does Shared Versioned Match Buffer will keep increasing even usage of within clause? And if it's not what is the expected behaviour upon match timeout?

Your helped previously is much appreciated thank you

On Tue, Nov 19, 2019 at 9:42 PM Dawid Wysakowicz <[hidden email]> wrote:

Hi Arujit,

It is hard for me to explain the memory consumption in your queries exactly as I don't know what is the size of your records, input rate, what is the exact query that you are running etc. (is the query you posted actually valid? the eventA as TABLE1='conditionA' looks rather strange).

Let me try to explain a bit though how the CEP operator works and point out some important facts one must take into account when using the MATCH recognize. First of all cep operator needs events to be sorted, as the underlying automaton works on sorted stream. Therefore it will buffer all the records until a watermark arrives and only after that it will feed the records into the automaton. Secondly, in order to evaluate transitions, the automaton keeps records in the state as long as it might need them for evaluating future conditions. For example if you have a simple pattern like A B. When an event that satisfied the condition of A arrives it is put into the state until the next event arrives (if it satisfies the B condition a match is emitted, if not the partial match is invalidated because of the strict continuity) or until the timeout on a match (e.g. 1 hour in the example you showed).

Hope this explanation will help you narrow down your problem. Let me know if something is not clear.

Best,

Dawid

On 18/11/2019 09:42, Arujit Pradhan wrote:
Hi all,

So we were spiking Flink CEP SQLs recently and we find that the state size of our Flink jobs which use pattern matching keep on increasing.

One sample skeleton of our SQL query looks something like this :
SELECT * FROM (
SELECT col1, col2 from TABLE1
LEFT JOIN TABLE2
ON
TABLE1.id = table2.fid
AND
TABLE1.event_time BETWEEN TABLE2.event_time - INTERVAL '5' MINUTE
AND
TABLE2.event_time + INTERVAL '5' MINUTE
) MATCH_RECOGNIZE(
PARTITION BY TABLE1.id
ORDER BY event_time
MEASURES eventA.id
PATTERN (eventA, eventB) within INTERVAL '1' HOUR
DEFINE
eventA as TABLE1='conditionA',
eventB as TABLE2='conditionB'
) AS T

Interestingly the state size of the CEP operator is really high as compared to other stages of the query (Image attached below).
image.png


The overall checkpoint size can be found in this metric. In some cases, the state size grows up to GBs and cause out of memory error.
image.png


We are using Flink-1.9, but earlier we were facing this issue even with Flink-1.8. It will be really helpful if you can point out the reason which may be causing this abnormal behaviour.


Thanks and regards,
Arujit.


signature.asc (849 bytes) Download Attachment
Reply | Threaded
Open this post in threaded view
|

Re: Memory in CEP queries keep increasing

Dawid Wysakowicz-2
In reply to this post by Muhammad Hakim

Hi,

I had another look into the CEP operator. Could you tell a bit more about the data that you are feeding into the operator?

  1. Do you run your query in event or processing time?
  2. How do events for a single delivery_id look like? Is it the case that after an event with status 'ON_POST_OFFICE' you see no more events for that id anymore?

If it is the case that your event stream is sparse on a per key basis you might be hitting a limitation/bug in the CEP operator. The cleanup might not kick in if there are no incoming events for a key. I created a jira issue to track this problem: https://issues.apache.org/jira/browse/FLINK-15160. What you could do to verify if that's the case is you could try injecting some heartbeats for your devices that would ensure there are events flowing for all devices. I know this is not a solution for the problem, as it could affect your patterns, but it could let us verify the root cause.

Best,

Dawid

On 02/12/2019 11:09, Muhammad Hakim wrote:
Hi Dawid,
Thank you for your previous response.
We've been looking for why our state size keeps increasing based on the clue that you gave. We've run a couple of experiments and also try to understand how state is handled in CEP operator.
We notice partial match is handled through something called Shared Versioned Match Buffer. We haven't look into detail implementation of this buffer cleaned up upon timeout or completed.
We ran experiment with 2 kinds of operation. One is Query which has no match at all. Another one is Query which has only one match, and the pattern will never be satisfied. Both of them run using WITHIN '1' MINUTE time.
Following are the query:
-- One Match --
SELECT delivery_id
FROM booking MATCH_RECOGNIZE (
PARTITION BY delivery_id
ORDER BY timestamp
MEASURES
A.delivery_id as delivery_id
MATCH_ROWTIME() AS window_timestamp
AFTER MATCH SKIP PAST LAST ROW
PATTERN (A B C) WITHIN INTERVAL '1' MINUTE
DEFINE
A AS status = 'ON_POST_OFFICE',
B AS status = 'invalid_status_1',
C AS status = 'invalid_status_2'
)

-- No Match --
SELECT delivery_id
FROM booking MATCH_RECOGNIZE (
PARTITION BY delivery_id
ORDER BY timestamp
MEASURES
A.delivery_id as delivery_id
MATCH_ROWTIME() AS window_timestamp
AFTER MATCH SKIP PAST LAST ROW
PATTERN (A B C) WITHIN INTERVAL '1' MINUTE
DEFINE
A AS status = 'invalid_status_1',
B AS status = 'invalid_status_2',
C AS status = 'invalid_status_3'
)

We tracked checkpointed state size and here is the result:
One Partial Match
OneMatchedStats.png
No Match At all
NonMatchedStats.png

From stats that we captured. We got partial match keep increasing until at the point of task manager couldn't handle it and it keeps restarting. While another one that does not have partial match/completed match shown stable memory consumption.
And as Arujit said the one with high memory consumption came from CEP operator. This job only generate two operator in the jobGraph, custom source and CEP operator.

Based on this experiments can you tell us what happened? Does Shared Versioned Match Buffer will keep increasing even usage of within clause? And if it's not what is the expected behaviour upon match timeout?

Your helped previously is much appreciated thank you

On Tue, Nov 19, 2019 at 9:42 PM Dawid Wysakowicz <[hidden email]> wrote:

Hi Arujit,

It is hard for me to explain the memory consumption in your queries exactly as I don't know what is the size of your records, input rate, what is the exact query that you are running etc. (is the query you posted actually valid? the eventA as TABLE1='conditionA' looks rather strange).

Let me try to explain a bit though how the CEP operator works and point out some important facts one must take into account when using the MATCH recognize. First of all cep operator needs events to be sorted, as the underlying automaton works on sorted stream. Therefore it will buffer all the records until a watermark arrives and only after that it will feed the records into the automaton. Secondly, in order to evaluate transitions, the automaton keeps records in the state as long as it might need them for evaluating future conditions. For example if you have a simple pattern like A B. When an event that satisfied the condition of A arrives it is put into the state until the next event arrives (if it satisfies the B condition a match is emitted, if not the partial match is invalidated because of the strict continuity) or until the timeout on a match (e.g. 1 hour in the example you showed).

Hope this explanation will help you narrow down your problem. Let me know if something is not clear.

Best,

Dawid

On 18/11/2019 09:42, Arujit Pradhan wrote:
Hi all,

So we were spiking Flink CEP SQLs recently and we find that the state size of our Flink jobs which use pattern matching keep on increasing.

One sample skeleton of our SQL query looks something like this :
SELECT * FROM (
SELECT col1, col2 from TABLE1
LEFT JOIN TABLE2
ON
TABLE1.id = table2.fid
AND
TABLE1.event_time BETWEEN TABLE2.event_time - INTERVAL '5' MINUTE
AND
TABLE2.event_time + INTERVAL '5' MINUTE
) MATCH_RECOGNIZE(
PARTITION BY TABLE1.id
ORDER BY event_time
MEASURES eventA.id
PATTERN (eventA, eventB) within INTERVAL '1' HOUR
DEFINE
eventA as TABLE1='conditionA',
eventB as TABLE2='conditionB'
) AS T

Interestingly the state size of the CEP operator is really high as compared to other stages of the query (Image attached below).
image.png


The overall checkpoint size can be found in this metric. In some cases, the state size grows up to GBs and cause out of memory error.
image.png


We are using Flink-1.9, but earlier we were facing this issue even with Flink-1.8. It will be really helpful if you can point out the reason which may be causing this abnormal behaviour.


Thanks and regards,
Arujit.


signature.asc (849 bytes) Download Attachment
Reply | Threaded
Open this post in threaded view
|

Re: Memory in CEP queries keep increasing

Muhammad Hakim
Hi,

We are using event time. Based on Dawid's answer and the Jira issue that he created. It actually makes sense. The nature of our events makes it possible the delivery 'CANCELLED' right away before even close to within time boundary. And after it 'CANCELLED' there won't be any event for that key, thus persist the partial match for that key in memory.

Sorry, I couldn't reply sooner, been busy with something else.

On Mon, Dec 9, 2019 at 6:57 PM Dawid Wysakowicz <[hidden email]> wrote:

Hi,

I had another look into the CEP operator. Could you tell a bit more about the data that you are feeding into the operator?

  1. Do you run your query in event or processing time?
  2. How do events for a single delivery_id look like? Is it the case that after an event with status 'ON_POST_OFFICE' you see no more events for that id anymore?

If it is the case that your event stream is sparse on a per key basis you might be hitting a limitation/bug in the CEP operator. The cleanup might not kick in if there are no incoming events for a key. I created a jira issue to track this problem: https://issues.apache.org/jira/browse/FLINK-15160. What you could do to verify if that's the case is you could try injecting some heartbeats for your devices that would ensure there are events flowing for all devices. I know this is not a solution for the problem, as it could affect your patterns, but it could let us verify the root cause.

Best,

Dawid

On 02/12/2019 11:09, Muhammad Hakim wrote:
Hi Dawid,
Thank you for your previous response.
We've been looking for why our state size keeps increasing based on the clue that you gave. We've run a couple of experiments and also try to understand how state is handled in CEP operator.
We notice partial match is handled through something called Shared Versioned Match Buffer. We haven't look into detail implementation of this buffer cleaned up upon timeout or completed.
We ran experiment with 2 kinds of operation. One is Query which has no match at all. Another one is Query which has only one match, and the pattern will never be satisfied. Both of them run using WITHIN '1' MINUTE time.
Following are the query:
-- One Match --
SELECT delivery_id
FROM booking MATCH_RECOGNIZE (
PARTITION BY delivery_id
ORDER BY timestamp
MEASURES
A.delivery_id as delivery_id
MATCH_ROWTIME() AS window_timestamp
AFTER MATCH SKIP PAST LAST ROW
PATTERN (A B C) WITHIN INTERVAL '1' MINUTE
DEFINE
A AS status = 'ON_POST_OFFICE',
B AS status = 'invalid_status_1',
C AS status = 'invalid_status_2'
)

-- No Match --
SELECT delivery_id
FROM booking MATCH_RECOGNIZE (
PARTITION BY delivery_id
ORDER BY timestamp
MEASURES
A.delivery_id as delivery_id
MATCH_ROWTIME() AS window_timestamp
AFTER MATCH SKIP PAST LAST ROW
PATTERN (A B C) WITHIN INTERVAL '1' MINUTE
DEFINE
A AS status = 'invalid_status_1',
B AS status = 'invalid_status_2',
C AS status = 'invalid_status_3'
)

We tracked checkpointed state size and here is the result:
One Partial Match
OneMatchedStats.png
No Match At all
NonMatchedStats.png

From stats that we captured. We got partial match keep increasing until at the point of task manager couldn't handle it and it keeps restarting. While another one that does not have partial match/completed match shown stable memory consumption.
And as Arujit said the one with high memory consumption came from CEP operator. This job only generate two operator in the jobGraph, custom source and CEP operator.

Based on this experiments can you tell us what happened? Does Shared Versioned Match Buffer will keep increasing even usage of within clause? And if it's not what is the expected behaviour upon match timeout?

Your helped previously is much appreciated thank you

On Tue, Nov 19, 2019 at 9:42 PM Dawid Wysakowicz <[hidden email]> wrote:

Hi Arujit,

It is hard for me to explain the memory consumption in your queries exactly as I don't know what is the size of your records, input rate, what is the exact query that you are running etc. (is the query you posted actually valid? the eventA as TABLE1='conditionA' looks rather strange).

Let me try to explain a bit though how the CEP operator works and point out some important facts one must take into account when using the MATCH recognize. First of all cep operator needs events to be sorted, as the underlying automaton works on sorted stream. Therefore it will buffer all the records until a watermark arrives and only after that it will feed the records into the automaton. Secondly, in order to evaluate transitions, the automaton keeps records in the state as long as it might need them for evaluating future conditions. For example if you have a simple pattern like A B. When an event that satisfied the condition of A arrives it is put into the state until the next event arrives (if it satisfies the B condition a match is emitted, if not the partial match is invalidated because of the strict continuity) or until the timeout on a match (e.g. 1 hour in the example you showed).

Hope this explanation will help you narrow down your problem. Let me know if something is not clear.

Best,

Dawid

On 18/11/2019 09:42, Arujit Pradhan wrote:
Hi all,

So we were spiking Flink CEP SQLs recently and we find that the state size of our Flink jobs which use pattern matching keep on increasing.

One sample skeleton of our SQL query looks something like this :
SELECT * FROM (
SELECT col1, col2 from TABLE1
LEFT JOIN TABLE2
ON
TABLE1.id = table2.fid
AND
TABLE1.event_time BETWEEN TABLE2.event_time - INTERVAL '5' MINUTE
AND
TABLE2.event_time + INTERVAL '5' MINUTE
) MATCH_RECOGNIZE(
PARTITION BY TABLE1.id
ORDER BY event_time
MEASURES eventA.id
PATTERN (eventA, eventB) within INTERVAL '1' HOUR
DEFINE
eventA as TABLE1='conditionA',
eventB as TABLE2='conditionB'
) AS T

Interestingly the state size of the CEP operator is really high as compared to other stages of the query (Image attached below).
image.png


The overall checkpoint size can be found in this metric. In some cases, the state size grows up to GBs and cause out of memory error.
image.png


We are using Flink-1.9, but earlier we were facing this issue even with Flink-1.8. It will be really helpful if you can point out the reason which may be causing this abnormal behaviour.


Thanks and regards,
Arujit.