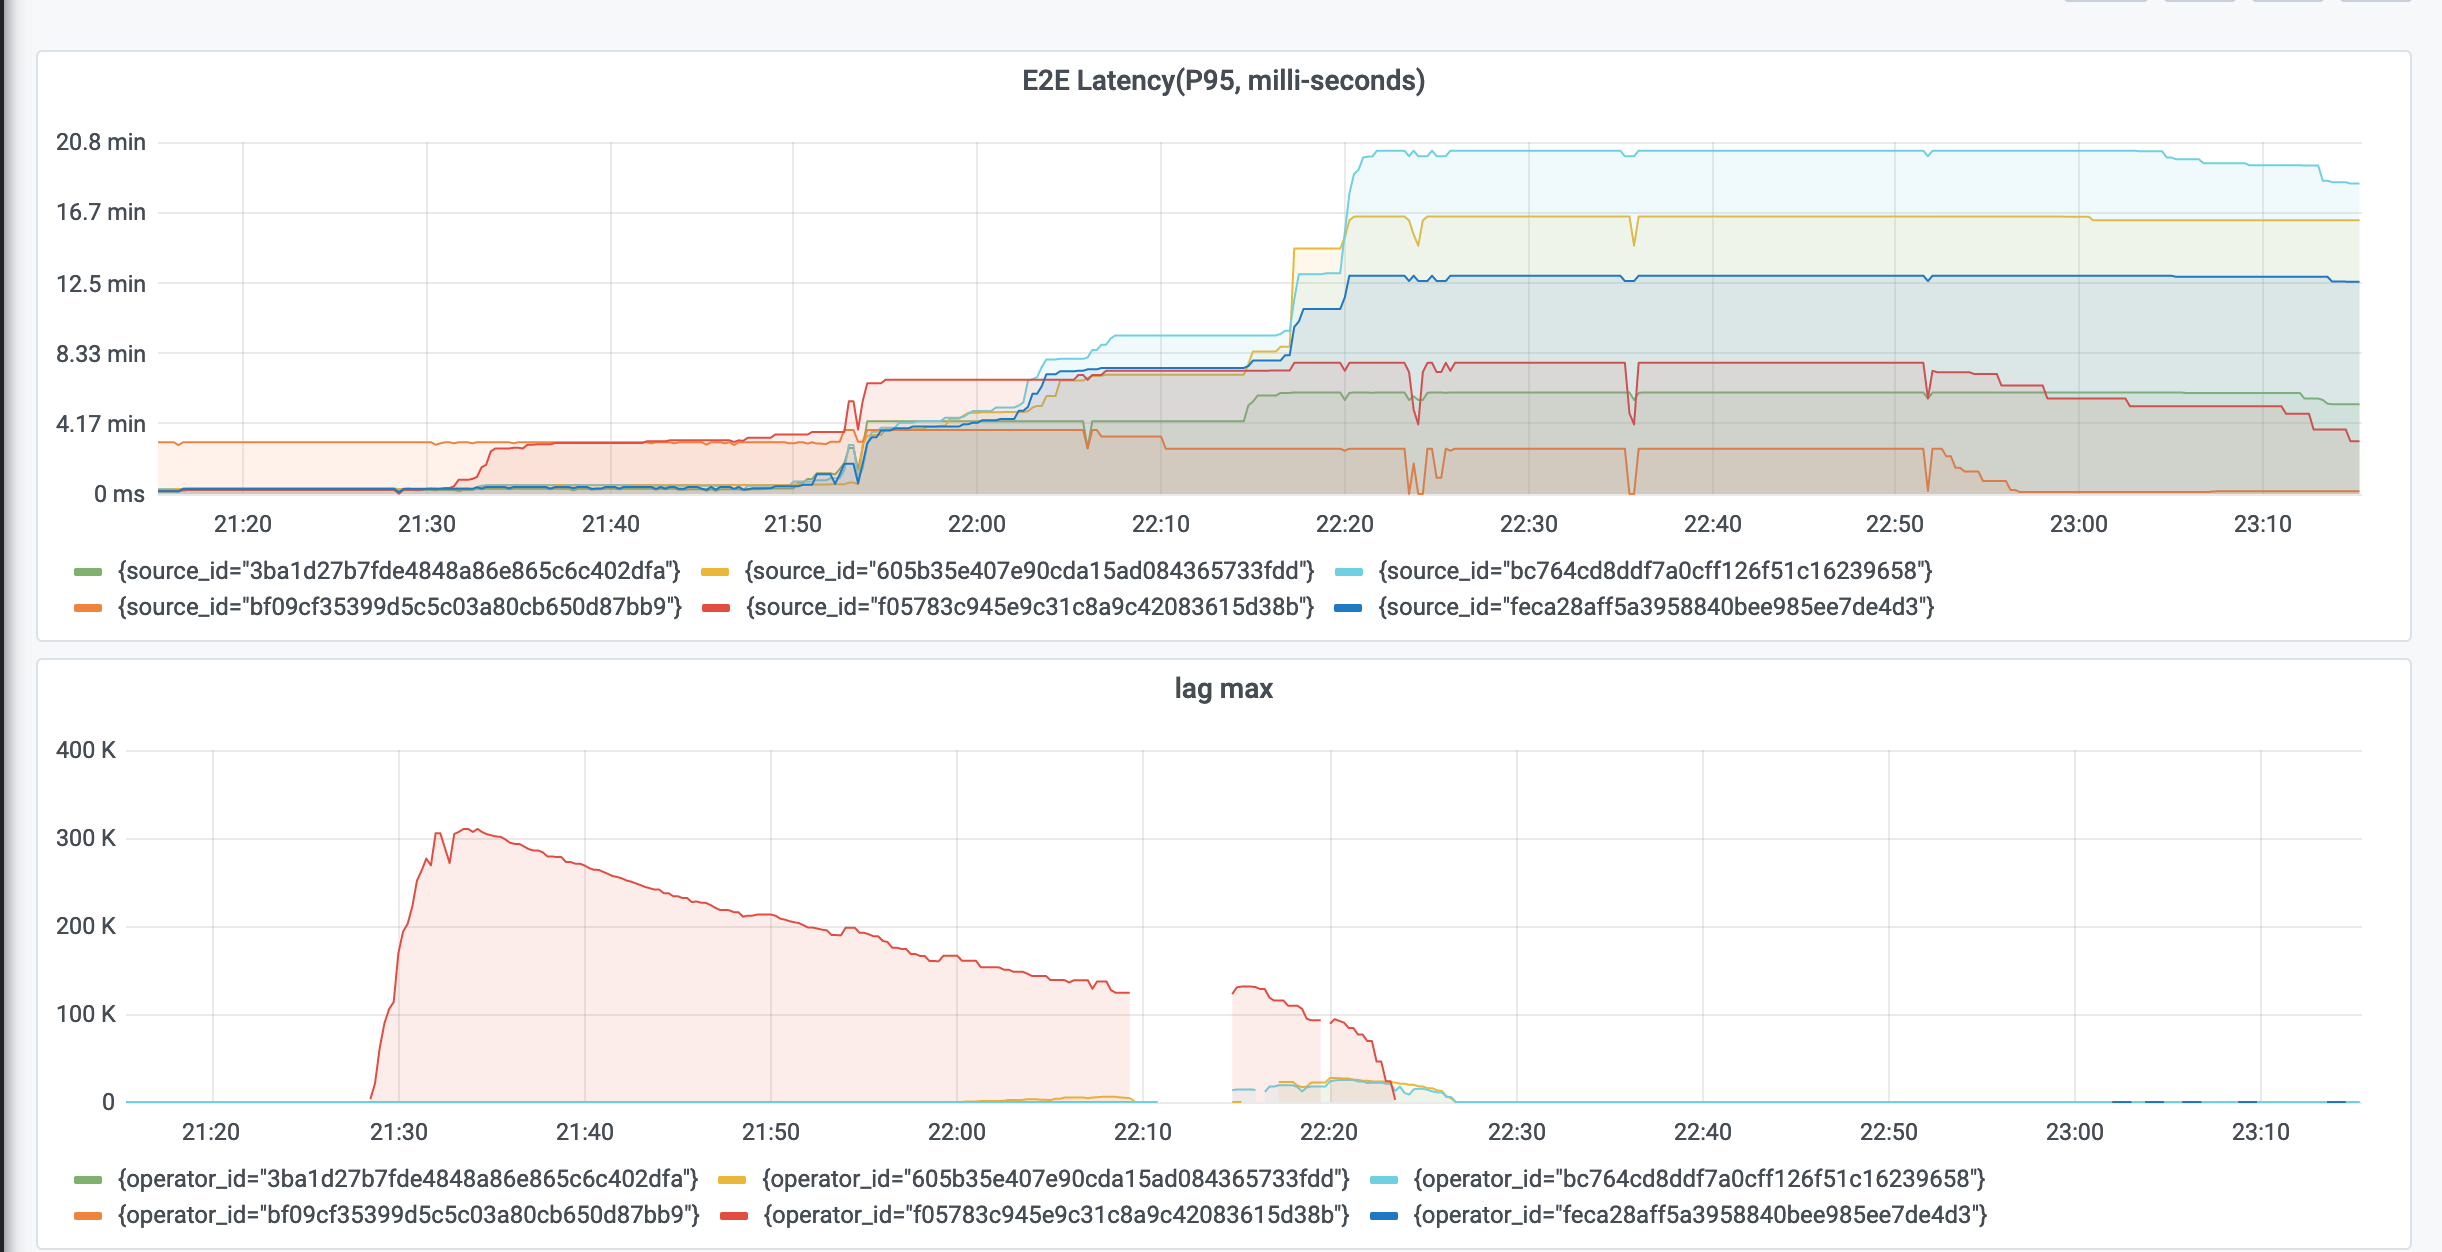
Latency metrics is not aligned with other metrics like max
|
Hi team, I found that latency metrics of Flink does not match with other metrics like lag max, and CPU utilization etc. As shown in the figures below, lag max is reaching 0 and CPU utilization is dropping down to normal, while the latency metrics remain still for quite a long time then drops down slowly. I'm confused by this and think the latency should become 0 about the same time of max lag and CPU utilization. Could anyone shed some light on this?   Best wishes, - Kai |
Re: Latency metrics is not aligned with other metrics like max
|
Hi Kai, On Mon, Apr 26, 2021 at 5:23 PM Kai Fu <[hidden email]> wrote:
Can you provide some more details on the topology and the involved operators? From looking at the metrics you provided, I can just make a guess: - One source (Kafka partition?) has a sudden spike in messages, causing lag max to go up - CPU usage increases while the first operators consuming from this source catch up - After catchup is done, CPU usage drops again, but operator queues downstream have built up and cause high latency for a while Does this sound plausible in your case? Else we might have to dig deeper. Best regards, Nico |
|
Hi Nicolaus, Thank you for the response. The topology is that there are 6 input Kafka sources and they are doing chained left join. In the graph above, we're putting data into one of the streams at a high rate. Thus there's a spike in the lag max there. For your explanation, I believe the other subsequent operators will also consume a lot of CPU(JOIN is CPU intensive) even after the first operations consumption caught up. While it's not the case in the graph and that's the thing that bothers me. On Thu, Apr 29, 2021 at 12:01 AM Nicolaus Weidner <[hidden email]> wrote:
Best wishes, - Kai |
Re: Latency metrics is not aligned with other metrics like max
|
Hi Kai, sorry for the late reply. For further investigation of why latency remains high, you could try tracking the queues and backpressure of downstream tasks - especially for the sources with the highest latency in the graph. If you can repeat adding a lot of data to the Kafka source, you could check the UI for backpressure warnings [1]. Else, the inputQueueLength metrics [2] or backpressure-related metrics [3] may help in identifying which tasks are causing latency. Is there anything happening downstream after the left joins? Best wishes, Nico On Fri, Apr 30, 2021 at 4:24 AM Kai Fu <[hidden email]> wrote:
|
«
Return to (DEPRECATED) Apache Flink User Mailing List archive.
|
1 view|%1 views
| Free forum by Nabble | Edit this page |


