Latency Monitoring in Flink application

classic Classic list List threaded Threaded
3 messages Options
Reply | Threaded
Open this post in threaded view
|

Latency Monitoring in Flink application

Halfon, Roey

Hi All,
I'm looking for help regarding latency monitoring.

Let's say I have a simple streaming data flow with the following operators:
FlinkKafkaConsumer -> Map -> print.

In case I want to measure a latency of records processing in my dataflow, what would be the best opportunity?

I want to get the duration of processing input received in the source until it received by the sink/finished sink operation.

I've added my code: env.getConfig().setLatencyTrackingInterval(100);
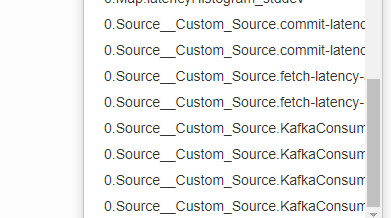
And then, the following latency metrics are available:

But I don't understand what exactly they are measuring? Also latency avg values are not seem to be related to latency as I see it.

I've tried also to use codahale metrics to get duration of some methods but it's not helping me to get a latency of record that processed in my whole pipeline.

Is the solution related to LatencyMarker? If yes, how can I reach it in my sink operation in order to retrieve it?

Thanks,
Roey.

Reply | Threaded
Open this post in threaded view
|

Re: Latency Monitoring in Flink application

Konstantin Knauf-2
Hi Roey, 

with Latency Tracking you will get a distribution of the time it took for LatencyMarkers to travel from each source operator to each downstream operator (per default one histogram per source operator in each non-source operator, see metrics.latency.granularity). 

LatencyMarkers are injected periodicaly in the sources and are flowing through the topology. They can not overtake regular records. LatencyMarkers pass through function (user code) without any delay. This means the latencies measured by latency tracking will only reflect a part of the end-to-end latency, in particular in non-backpressure scenarios. In backpressure scenarios latency markers will queue up before the slowest operator (as they can not overtake records) and the latency will better reflect the real latency in the pipeline. In my opinion, latency markers are not the right tool to measure the "user-facing/end-to-end latency" in a Flink application. For me this is a debugging tool to find sources of latency or congested channels.

I suggest, that instead of using latency tracking you add a histogram metric in the sink operator yourself, which depicts the difference between the current processing time and the event time to get a distribution of the event time lag at the source. If you do the same in the source (and any other points of interests) you will get a good picture of how the even-time lag changes over time.

Hope this helps. 

Cheers, 

Konstantin

On Thu, Jun 13, 2019 at 12:20 PM Halfon, Roey <[hidden email]> wrote:

Hi All,
I'm looking for help regarding latency monitoring.

Let's say I have a simple streaming data flow with the following operators:
FlinkKafkaConsumer -> Map -> print.

In case I want to measure a latency of records processing in my dataflow, what would be the best opportunity?

I want to get the duration of processing input received in the source until it received by the sink/finished sink operation.

I've added my code: env.getConfig().setLatencyTrackingInterval(100);
And then, the following latency metrics are available:

But I don't understand what exactly they are measuring? Also latency avg values are not seem to be related to latency as I see it.

I've tried also to use codahale metrics to get duration of some methods but it's not helping me to get a latency of record that processed in my whole pipeline.

Is the solution related to LatencyMarker? If yes, how can I reach it in my sink operation in order to retrieve it?

Thanks,
Roey.


--

Konstantin Knauf | Solutions Architect

+49 160 91394525


Planned Absences: 20. - 21.06.2019, 10.08.2019 - 31.08.2019, 05.09. - 06.09.2010


--

Data Artisans GmbH | Invalidenstrasse 115, 10115 Berlin, Germany

--

Data Artisans GmbH
Registered at Amtsgericht Charlottenburg: HRB 158244 B
Managing Directors: Dr. Kostas Tzoumas, Dr. Stephan Ewen   
Reply | Threaded
Open this post in threaded view
|

Re: Latency Monitoring in Flink application

Timothy Victor
Thanks for the insight.  I was also interested in this topic.

One thought occurred to me is what about the queuing delay when sending to your message bus (e.g. kafka).   I am guessing the probe will be before the message is added to the send queue?

Thanks again

Tim

On Thu, Jun 13, 2019, 6:08 AM Konstantin Knauf <[hidden email]> wrote:
Hi Roey, 

with Latency Tracking you will get a distribution of the time it took for LatencyMarkers to travel from each source operator to each downstream operator (per default one histogram per source operator in each non-source operator, see metrics.latency.granularity). 

LatencyMarkers are injected periodicaly in the sources and are flowing through the topology. They can not overtake regular records. LatencyMarkers pass through function (user code) without any delay. This means the latencies measured by latency tracking will only reflect a part of the end-to-end latency, in particular in non-backpressure scenarios. In backpressure scenarios latency markers will queue up before the slowest operator (as they can not overtake records) and the latency will better reflect the real latency in the pipeline. In my opinion, latency markers are not the right tool to measure the "user-facing/end-to-end latency" in a Flink application. For me this is a debugging tool to find sources of latency or congested channels.

I suggest, that instead of using latency tracking you add a histogram metric in the sink operator yourself, which depicts the difference between the current processing time and the event time to get a distribution of the event time lag at the source. If you do the same in the source (and any other points of interests) you will get a good picture of how the even-time lag changes over time.

Hope this helps. 

Cheers, 

Konstantin

On Thu, Jun 13, 2019 at 12:20 PM Halfon, Roey <[hidden email]> wrote:

Hi All,
I'm looking for help regarding latency monitoring.

Let's say I have a simple streaming data flow with the following operators:
FlinkKafkaConsumer -> Map -> print.

In case I want to measure a latency of records processing in my dataflow, what would be the best opportunity?

I want to get the duration of processing input received in the source until it received by the sink/finished sink operation.

I've added my code: env.getConfig().setLatencyTrackingInterval(100);
And then, the following latency metrics are available:

But I don't understand what exactly they are measuring? Also latency avg values are not seem to be related to latency as I see it.

I've tried also to use codahale metrics to get duration of some methods but it's not helping me to get a latency of record that processed in my whole pipeline.

Is the solution related to LatencyMarker? If yes, how can I reach it in my sink operation in order to retrieve it?

Thanks,
Roey.


--

Konstantin Knauf | Solutions Architect

+49 160 91394525


Planned Absences: 20. - 21.06.2019, 10.08.2019 - 31.08.2019, 05.09. - 06.09.2010


--

Data Artisans GmbH | Invalidenstrasse 115, 10115 Berlin, Germany

--

Data Artisans GmbH
Registered at Amtsgericht Charlottenburg: HRB 158244 B
Managing Directors: Dr. Kostas Tzoumas, Dr. Stephan Ewen