Kafka source task checkpoint time is increasing over time

classic Classic list List threaded Threaded
4 messages Options
Reply | Threaded
Open this post in threaded view
|

Kafka source task checkpoint time is increasing over time

Slim Bouguerra
Hi,
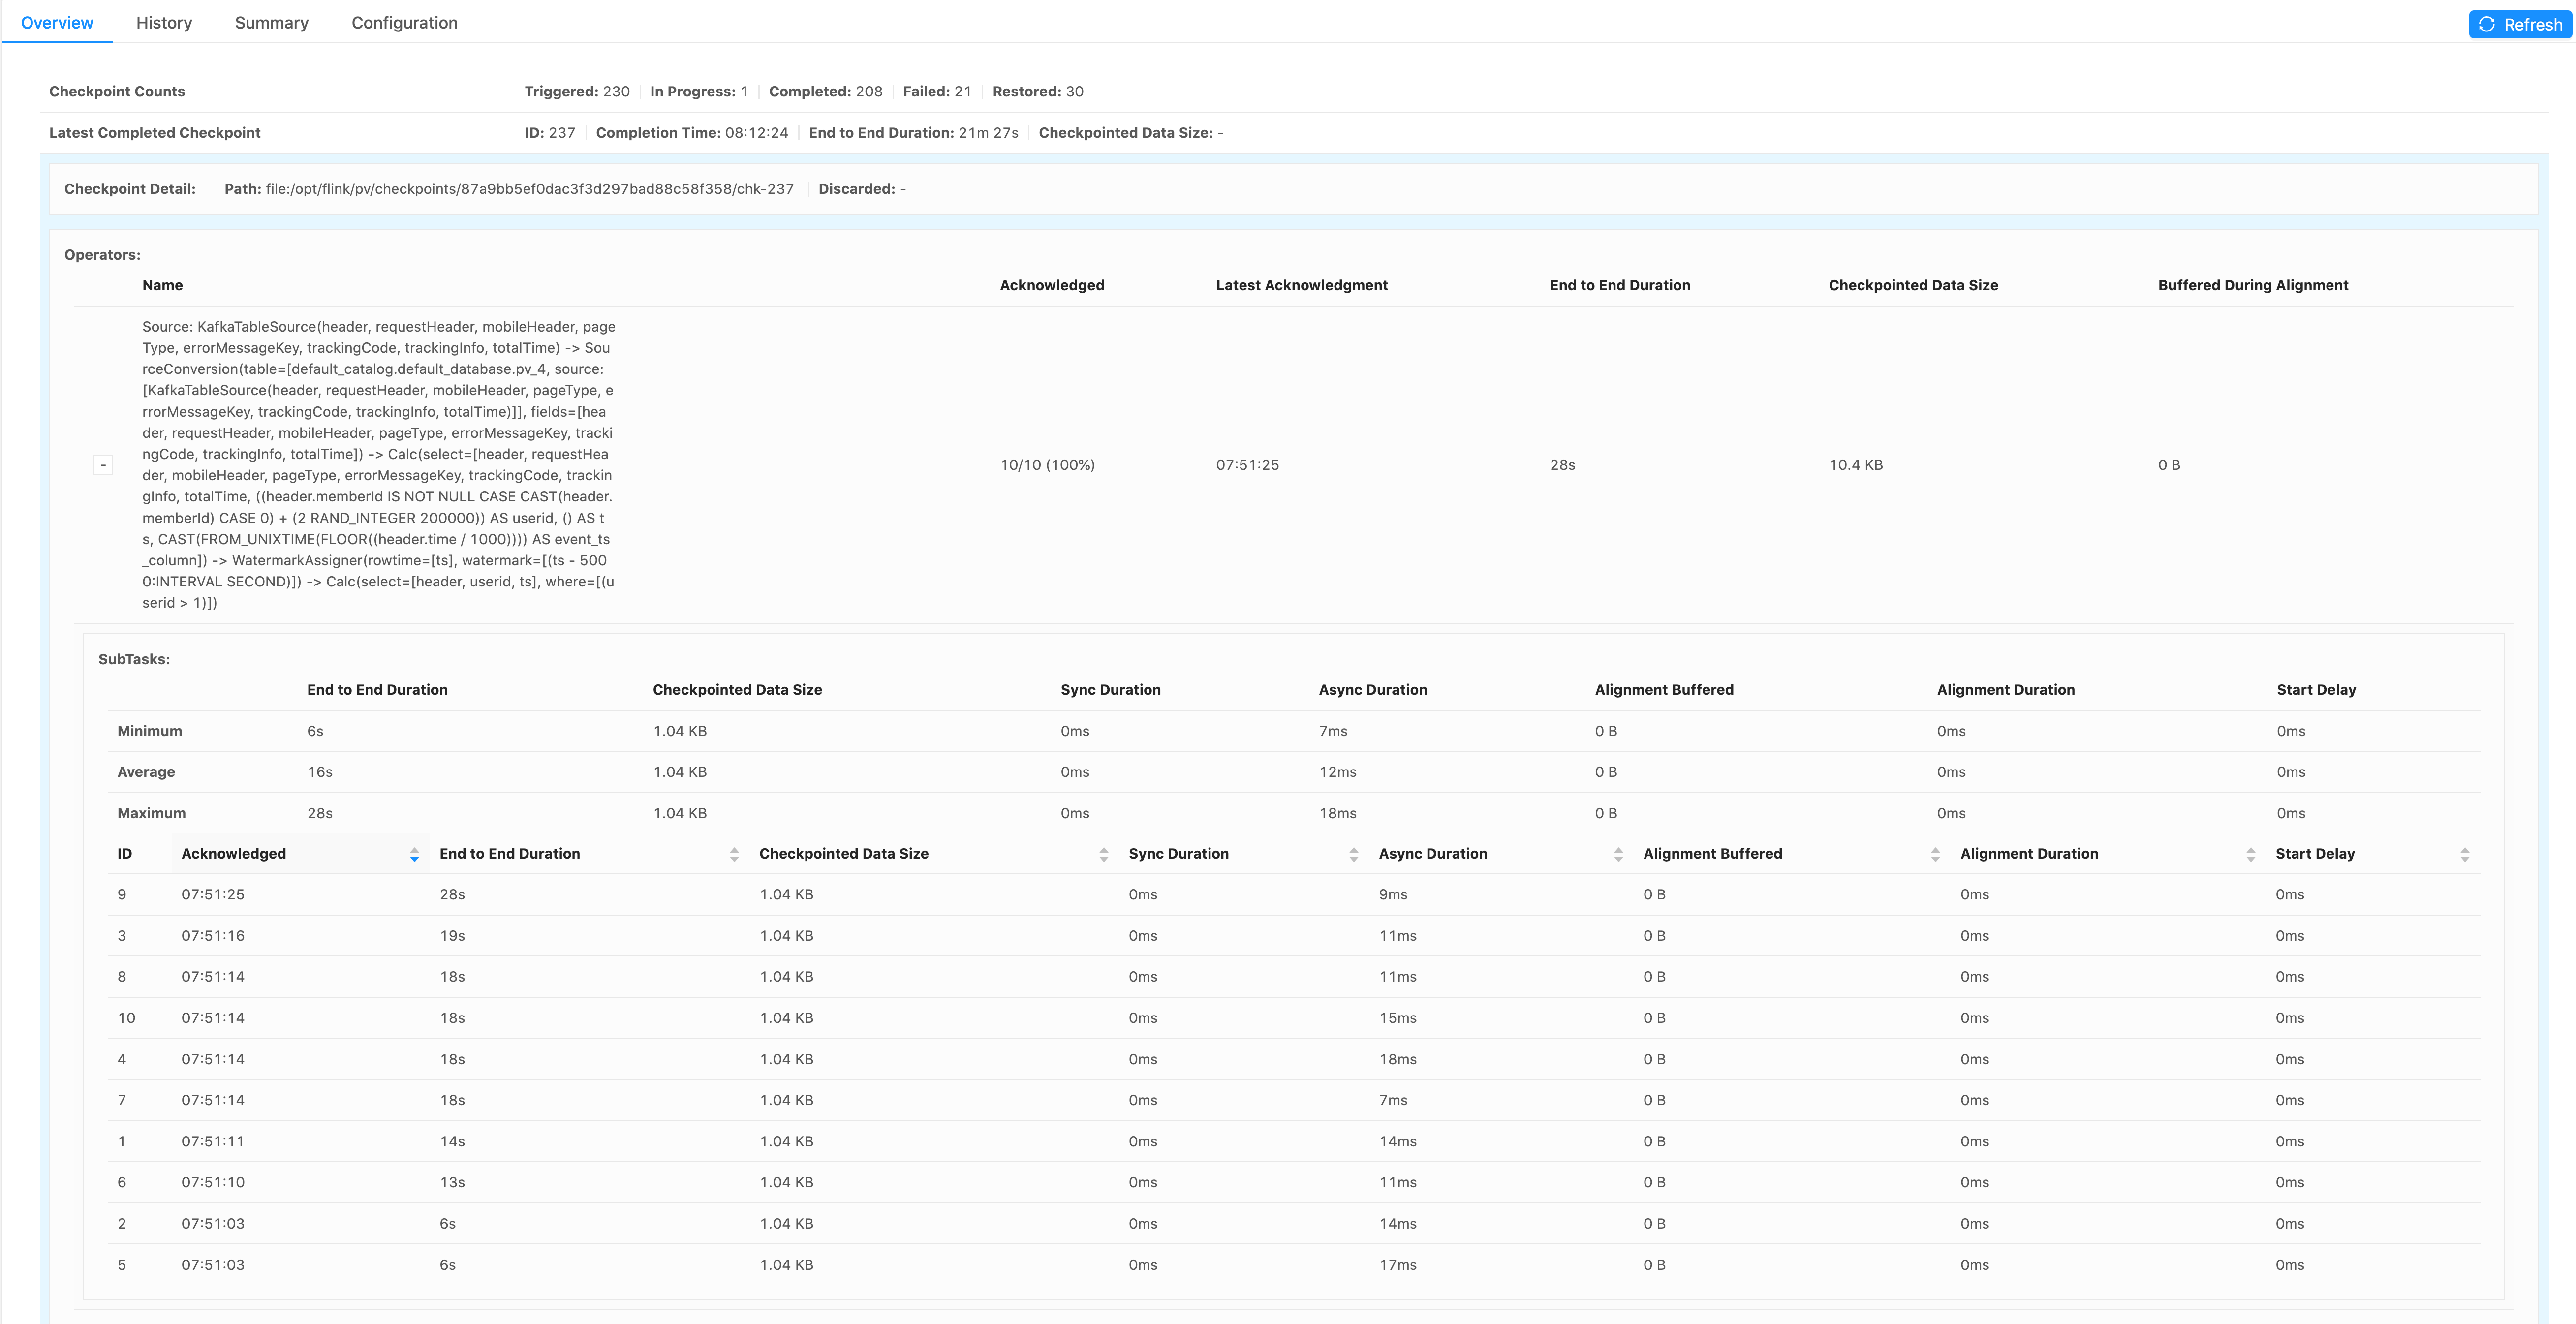
I am observing that over time the end to end duration of single source Kafka task checkpointing is increasing from one second to minutes. In addition I see a big variance between tasks of the same source order of magnitude in some cases.
I am not able to understand why since this is a source task aka there is no dependency on other tasks and the checkpoint file size is always the same (1KB).
As you can see in the attached print screen the sync and async duration are very small (ms) there are no alignements and the start delay is 0.
This is running in a setup where I can not afford running with debug logging and at the info level I can not find where this extra time is spent.
My question is where can I find where those minutes are spent and how to ensure that it is not increasing over time.
Any pointers to how I can debug this  why there is such big variance between tasks ?

Using Flink 1.11.1 Java 8, Running in Docker, K8S running a session cluster with a single job.

print_screen_as_dec_7.png


Thanks.

--

B-Slim
_______/\/\/\_______/\/\/\_______/\/\/\_______/\/\/\_______/\/\/\_______
Reply | Threaded
Open this post in threaded view
|

Re: Kafka source task checkpoint time is increasing over time

r_khachatryan
Hi Slim,

This is most likely caused by back-pressure. 
Unaligned Checkpoints can reduce the impact of it on legacy sources, but not exclude completely.
You can check in the UI which tasks are back-pressured [1].

However, I see that total end-to-end time is much bigger (21m vs 28s), so I'd consider looking at other operators.

[1]

Regards,
Roman


On Mon, Dec 7, 2020 at 6:00 PM Slim Bouguerra <[hidden email]> wrote:
Hi,
I am observing that over time the end to end duration of single source Kafka task checkpointing is increasing from one second to minutes. In addition I see a big variance between tasks of the same source order of magnitude in some cases.
I am not able to understand why since this is a source task aka there is no dependency on other tasks and the checkpoint file size is always the same (1KB).
As you can see in the attached print screen the sync and async duration are very small (ms) there are no alignements and the start delay is 0.
This is running in a setup where I can not afford running with debug logging and at the info level I can not find where this extra time is spent.
My question is where can I find where those minutes are spent and how to ensure that it is not increasing over time.
Any pointers to how I can debug this  why there is such big variance between tasks ?

Using Flink 1.11.1 Java 8, Running in Docker, K8S running a session cluster with a single job.

print_screen_as_dec_7.png


Thanks.

--

B-Slim
_______/\/\/\_______/\/\/\_______/\/\/\_______/\/\/\_______/\/\/\_______
Reply | Threaded
Open this post in threaded view
|

Re: Kafka source task checkpoint time is increasing over time

Slim Bouguerra
Hi Khachatryan,
Thanks for your insight. Please help me understand this.
If operator A is source and it is back pressured by Operator B Sink I would Assume that the checkpointing state of operator A is very fast since no data has really moved between the 2 checkpoints.
In this Case if the Kafka Source (consumer) did not consume much data and the data to checkpoint is the same why the checkpoint is taking seconds ?  Is that because the checkpoint barrier is stuck in the network buffer between Operator A and B ?
I agree with you other operators are taking longer but I am trying to figure out what is happening with the simplest operator AKA the Sources. 


On Tue, Dec 8, 2020 at 8:47 AM Khachatryan Roman <[hidden email]> wrote:
Hi Slim,

This is most likely caused by back-pressure. 
Unaligned Checkpoints can reduce the impact of it on legacy sources, but not exclude completely.
You can check in the UI which tasks are back-pressured [1].

However, I see that total end-to-end time is much bigger (21m vs 28s), so I'd consider looking at other operators.

[1]

Regards,
Roman


On Mon, Dec 7, 2020 at 6:00 PM Slim Bouguerra <[hidden email]> wrote:
Hi,
I am observing that over time the end to end duration of single source Kafka task checkpointing is increasing from one second to minutes. In addition I see a big variance between tasks of the same source order of magnitude in some cases.
I am not able to understand why since this is a source task aka there is no dependency on other tasks and the checkpoint file size is always the same (1KB).
As you can see in the attached print screen the sync and async duration are very small (ms) there are no alignements and the start delay is 0.
This is running in a setup where I can not afford running with debug logging and at the info level I can not find where this extra time is spent.
My question is where can I find where those minutes are spent and how to ensure that it is not increasing over time.
Any pointers to how I can debug this  why there is such big variance between tasks ?

Using Flink 1.11.1 Java 8, Running in Docker, K8S running a session cluster with a single job.

print_screen_as_dec_7.png


Thanks.

--

B-Slim
_______/\/\/\_______/\/\/\_______/\/\/\_______/\/\/\_______/\/\/\_______


--

B-Slim
_______/\/\/\_______/\/\/\_______/\/\/\_______/\/\/\_______/\/\/\_______
Reply | Threaded
Open this post in threaded view
|

Re: Kafka source task checkpoint time is increasing over time

r_khachatryan
Hi Slim,

> In this Case if the Kafka Source (consumer) did not consume much data and the data to checkpoint is the same why the checkpoint is taking seconds ?  Is that because the checkpoint barrier is stuck in the network buffer between Operator A and B ?

It could have consumed not much data to checkpoint, but much more to sent downstream. 
So yes, the barrier stuck in source output channels is the most likely reason.
Other reasons may include clock skew and RPC from JM delay but they are much less likely. To be sure, I'd check backpressure as was mentioned before.

Hope this helps.

Regards,
Roman


On Tue, Dec 8, 2020 at 6:27 PM Slim Bouguerra <[hidden email]> wrote:
Hi Khachatryan,
Thanks for your insight. Please help me understand this.
If operator A is source and it is back pressured by Operator B Sink I would Assume that the checkpointing state of operator A is very fast since no data has really moved between the 2 checkpoints.
In this Case if the Kafka Source (consumer) did not consume much data and the data to checkpoint is the same why the checkpoint is taking seconds ?  Is that because the checkpoint barrier is stuck in the network buffer between Operator A and B ?
I agree with you other operators are taking longer but I am trying to figure out what is happening with the simplest operator AKA the Sources. 


On Tue, Dec 8, 2020 at 8:47 AM Khachatryan Roman <[hidden email]> wrote:
Hi Slim,

This is most likely caused by back-pressure. 
Unaligned Checkpoints can reduce the impact of it on legacy sources, but not exclude completely.
You can check in the UI which tasks are back-pressured [1].

However, I see that total end-to-end time is much bigger (21m vs 28s), so I'd consider looking at other operators.

[1]

Regards,
Roman


On Mon, Dec 7, 2020 at 6:00 PM Slim Bouguerra <[hidden email]> wrote:
Hi,
I am observing that over time the end to end duration of single source Kafka task checkpointing is increasing from one second to minutes. In addition I see a big variance between tasks of the same source order of magnitude in some cases.
I am not able to understand why since this is a source task aka there is no dependency on other tasks and the checkpoint file size is always the same (1KB).
As you can see in the attached print screen the sync and async duration are very small (ms) there are no alignements and the start delay is 0.
This is running in a setup where I can not afford running with debug logging and at the info level I can not find where this extra time is spent.
My question is where can I find where those minutes are spent and how to ensure that it is not increasing over time.
Any pointers to how I can debug this  why there is such big variance between tasks ?

Using Flink 1.11.1 Java 8, Running in Docker, K8S running a session cluster with a single job.

print_screen_as_dec_7.png


Thanks.

--

B-Slim
_______/\/\/\_______/\/\/\_______/\/\/\_______/\/\/\_______/\/\/\_______


--

B-Slim
_______/\/\/\_______/\/\/\_______/\/\/\_______/\/\/\_______/\/\/\_______