Kafka Consumer consuming rate suddenly dropped


|
Hi, community
I have a flink application consuming from a kafka topic with 60 partitions. The parallelism of the source is set to 60, same with the topic partition number. The cluster.evenly-spread-out-slots config is set to true in flink cluster. However, several hours later, the consuming rate of some subtasks of the source suddenly dropped and caused delay. There is no back pressure in the application as shown in the flink UI. The consuming rate is like follows: 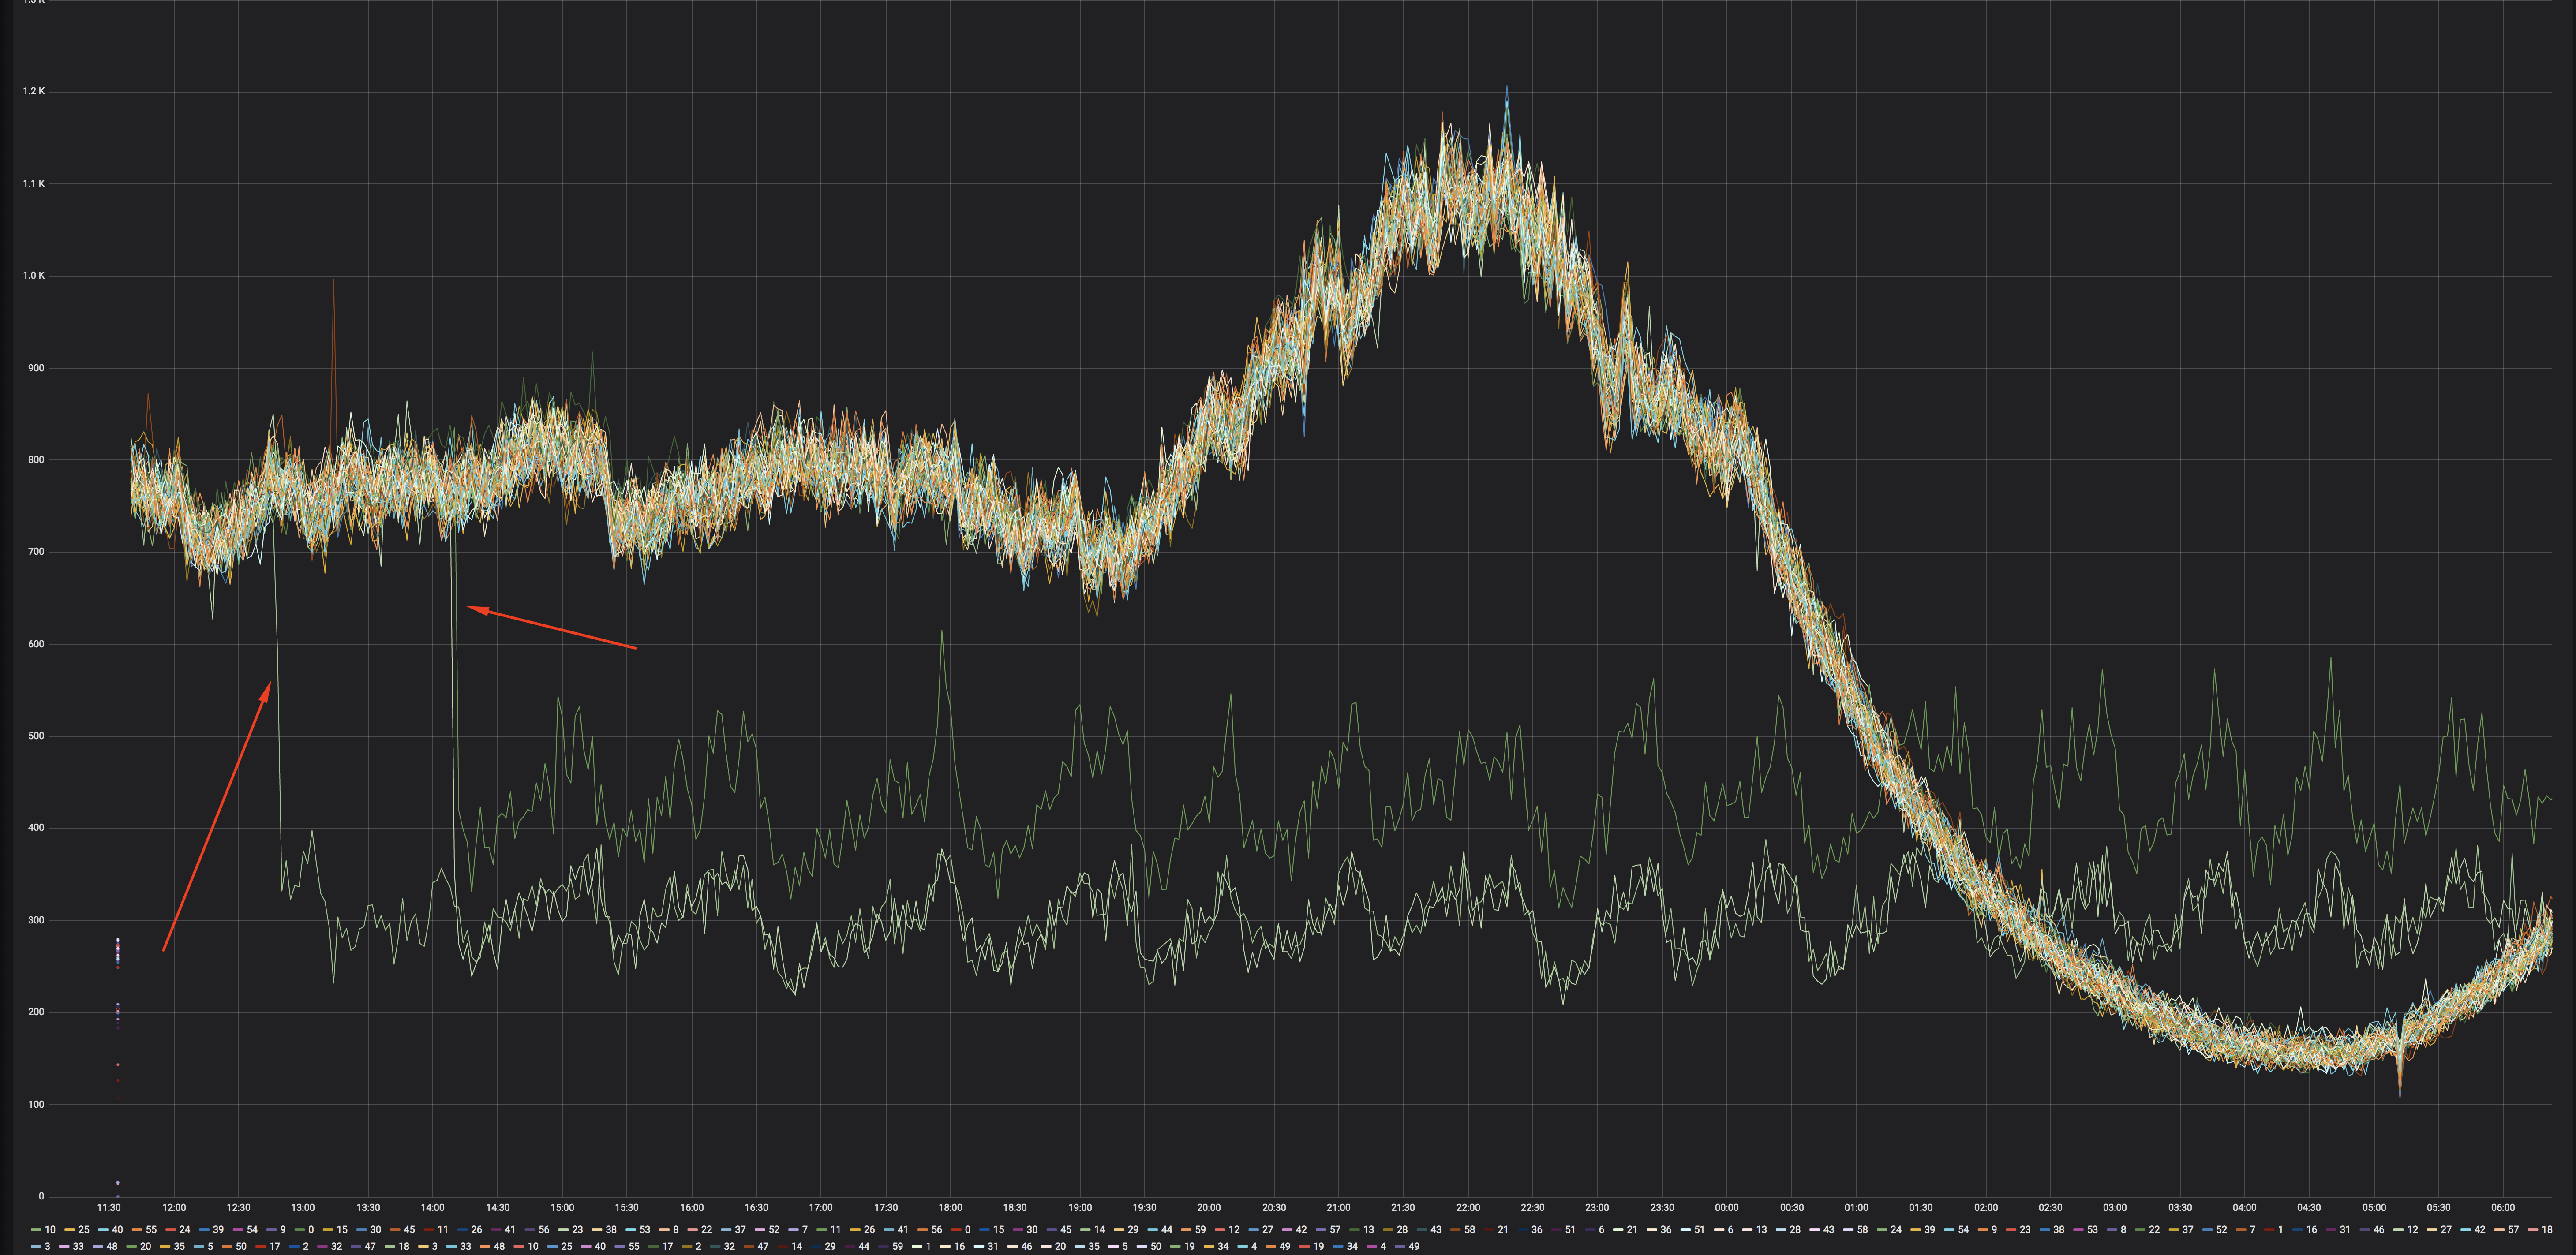 Is anyone also encountering the same problem? Is there any way to further pinpoint the issue? Thanks in advance! Mu |
Re: Kafka Consumer consuming rate suddenly dropped
|
|
Hi Mu, Did you check the resource utilization metrics for your cluster? I once faced a similar issue, and figured it was because the overall CPU Load of the cluster spiked to 1+. This may happen if the cluster is shared, and some new job was deployed. ~Akshay On Mon, Jul 20, 2020 at 3:23 PM Mu Kong <[hidden email]> wrote:
|

|
|
In reply to this post by Mu Kong
Need some flink kafka consumer log and kafka server log!
|
|
|
In reply to this post by Akshay Aggarwal
Hi Akshay, Thank you for helping out. I checked the resource metrics, the CPU usage is pretty low, lower than 25%. 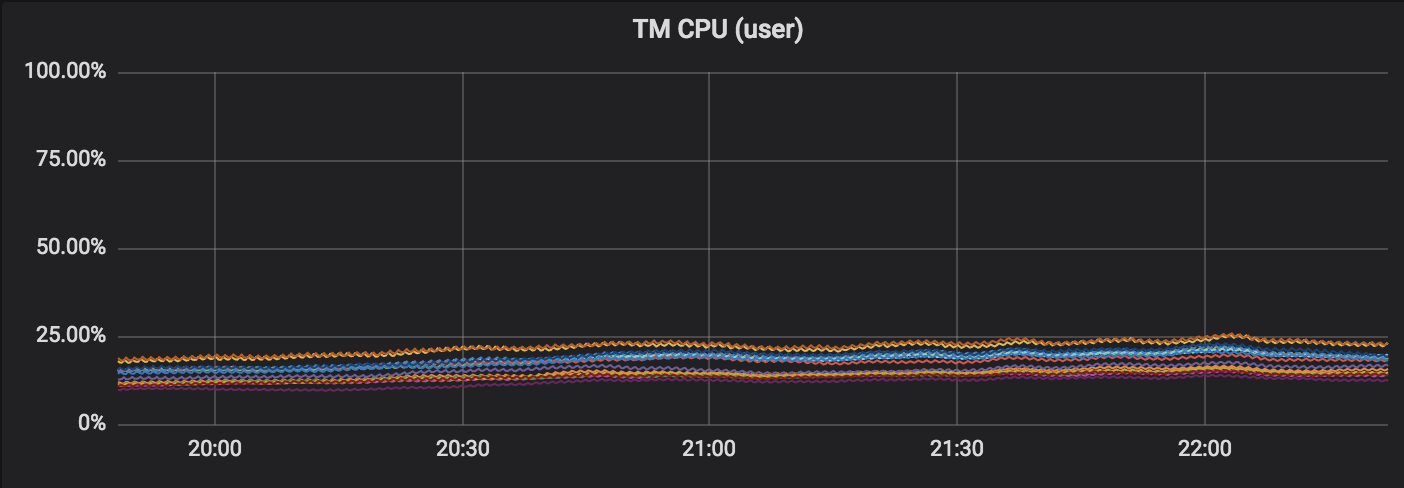 And the cluster (stand alone) is only running this job. Thanks all the same. Best regards, Mu On Mon, Jul 20, 2020 at 7:22 PM Jake <[hidden email]> wrote:
On Mon, Jul 20, 2020 at 7:19 PM Akshay Aggarwal <[hidden email]> wrote:
|

|
|
In reply to this post by Jake
Hi, Jake,
Thanks for offering help. I didn't find anything related to kafka in my tm log. Is there a way to enable the logging, or am I just looking into the wrong place? Thanks in advance. Best regards, Mu |
Re: Kafka Consumer consuming rate suddenly dropped
|
|
Hi Mu Kong, I think Jake was asking for the logs of your Kafka cluster and not the Flink TM logs. Cheers, Till On Wed, Jul 22, 2020 at 12:47 PM Mu Kong <[hidden email]> wrote:
|
|
|
Hi Mu Kong Yes, you need check your kafka cluser server log, network traffic, disk latency, cpu load. Jake
|
| Free forum by Nabble | Edit this page |