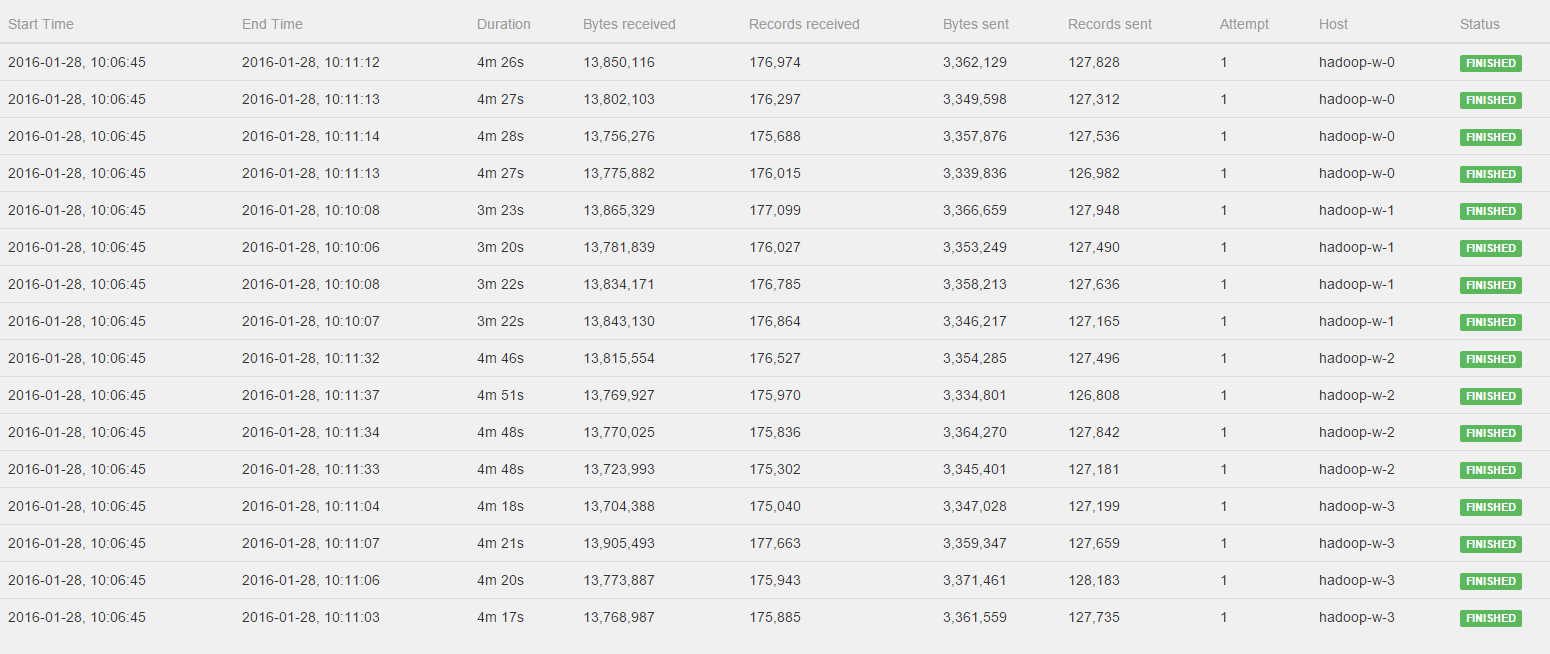
Imbalanced workload between workers

12

12
Re: Imbalanced workload between workers

|
Hey Pieter! Thanks for investigating this. If you can share the job and setup details (instance types, Hadoop, etc.) I can also run it. :-)
– Ufuk
On Saturday, February 6, 2016, Pieter Hameete <[hidden email]> wrote:
|

Re: Imbalanced workload between workers
|
|
Hi Ufuk,
You can find the job jar here: https://storage.googleapis.com/dawn-flink/dawn-flink-improved.jar I've used the Google Cloud setup with bdutil as described on https://ci.apache.org/projects/flink/flink-docs-release-0.10/setup/gce_setup.html but with a hadoop2 env, so deploying the cluster as follows: You should be able to reproduce with a JobManager and 2 TaskManagers. I used n1-standard-4 instances for both. Flink version used is 0.10.1. I ran the job as follows on 4 different size datasets in sequence as follows: ./flink run dawn-flink-improved.jar gs://dawn-flink/data/split8G <OUTFOLDER> 5 improved-8G.csv && ./flink run dawn-flink-improved.jar gs://dawn-flink/data/split4G <OUTFOLDER> 5 improved-4G.csv && ./flink run dawn-flink-improved.jar gs://dawn-flink/data/split2G <OUTFOLDER> 5 improved-2G.csv && ./flink run dawn-flink-improved.jar gs://dawn-flink/data/split1G <OUTFOLDER> 5 improved-1G.csv The datasets should be publicly available now, they are in the europe-west-1c region. Note that each of these runs 80 jobs (16 different queries, and 5 repetitions each). You should see slowdown happening for the second or third batch of jobs. Even though the dataset size is halved, for me it started tooking much more time to complete the batch of jobs. Can you work with this info? If there is anything else you need, please let me know! - Pieter 2016-02-07 9:20 GMT+01:00 Ufuk Celebi <[hidden email]>: Hey Pieter! Thanks for investigating this. If you can share the job and setup details (instance types, Hadoop, etc.) I can also run it. :-) |
Re: Imbalanced workload between workers
|
|
In reply to this post by Stephan Ewen
Hi Stephan, unfortunately I noticed similar behavior is happening on the YARN cluster that I am using now. The slowdown now occurred within a single batch, so at one of the later queries stuff started slowing down. Clearly something must be leaking.2016-02-06 15:12 GMT+01:00 Stephan Ewen <[hidden email]>:
|

Re: Imbalanced workload between workers
|
|
Hi! You can look this information up in the WebFrontend (starting from 0.10.x) and in a very detailed form in version 1.0-SNAPSHOT. Another helpful thing is to activate the memory/GC logger. Add the following lines to your configuration: taskmanager.debug.memory.startLogThread: true taskmanager.debug.memory.logIntervalMs: 5000 Greetings, Stephan On Tue, Feb 9, 2016 at 3:07 PM, Pieter Hameete <[hidden email]> wrote:
|

«
Return to (DEPRECATED) Apache Flink User Mailing List archive.
|
1 view|%1 views
| Free forum by Nabble | Edit this page |