How to read UI checkpoints section
How to read UI checkpoints section
|
Dear community,
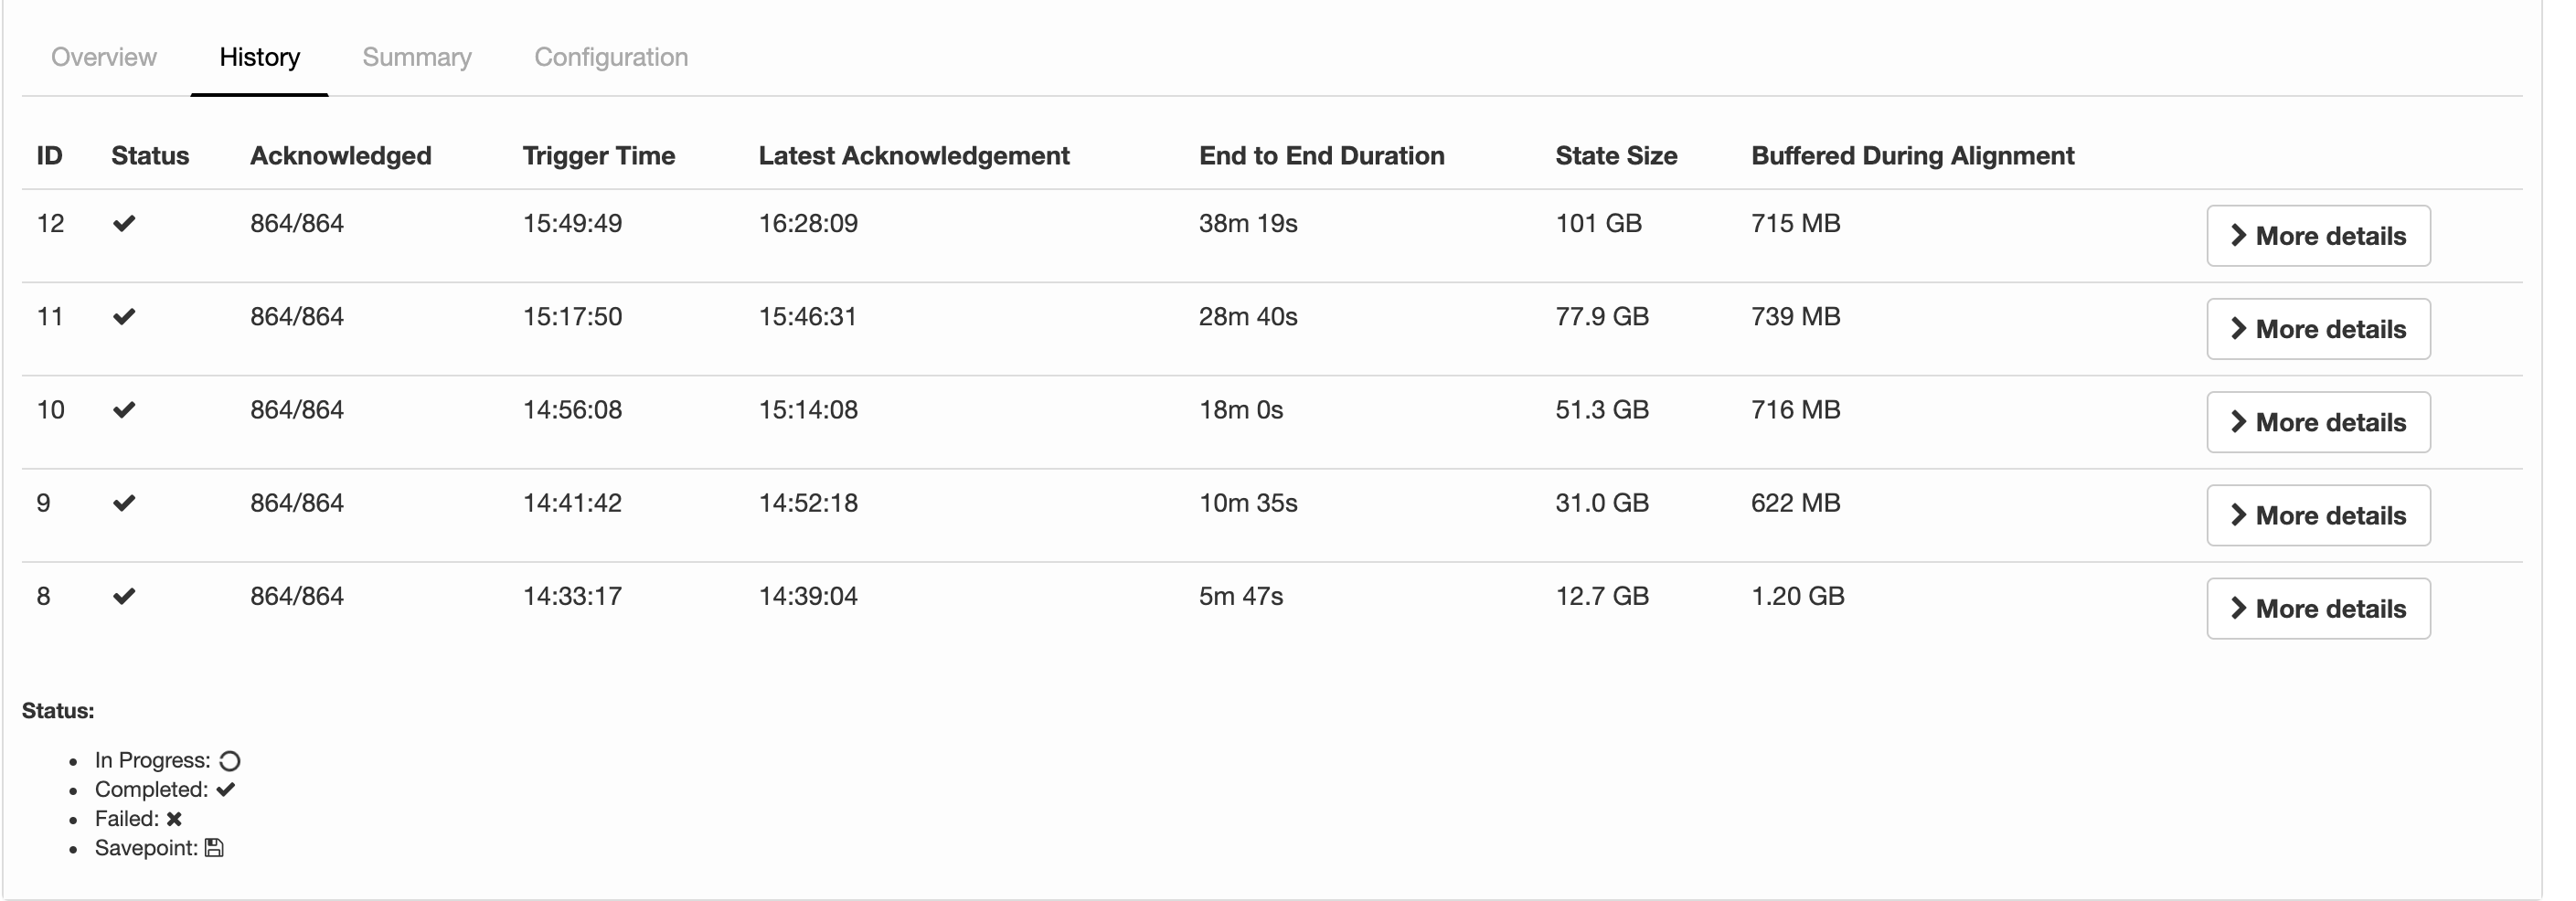
I'm running a job with flink-1.6.4 and the following configs about checkpointing: 2019-07-15 12:28:32,653 INFO org.apache.flink.runtime.jobmaster.JobMaster - Using application-defined state backend: RocksDBStateBackend{checkpointStreamBackend=File State Backend (checkpoints: 'hdfs://rbl1.radicalbit.io:8020/flink/checkpoint', savepoints: 'null', asynchronous: UNDEFINED, fileStateThreshold: -1), localRocksDbDirectories=null, enableIncrementalCheckpointing=TRUE} Long story short: I'd like to run checkpoints against RocksDB quite large state asynchronously and incrementally. What it actually reports my history is described below  I was expecting was State Size that is more or less fixed across checkpoints since the checkpoint mechanism is incremental and delta-based, but the state is actually every increasing and duration is always greater than the previous. Is this column representing just the delta size or the whole state size? If the checkpointing is still incremental, why the board is reporting always increasing metrics in terms of time and size? Thank you very much for your help, -- Andrea Spina Head of R&D @ Radicalbit Srl Via Giovanni Battista Pirelli 11, 20124, Milano - IT |
Re: How to read UI checkpoints section
|
Hi Andrea, The reported state size is the total size of the checkpoint (AFAIK). Regarding the incremental checkpointing, this is only helpful if not all keys are updated between two checkpoints. As soon as a key was touched, it needs to be synced. If all (or most of) your data changes between two checkpoints, incremental checkpoints do not help. Best, Fabian Am Mo., 15. Juli 2019 um 17:18 Uhr schrieb Andrea Spina <[hidden email]>:
|
Re: How to read UI checkpoints section
|
Hi Andrea 1. for Incremental mode, the column of state size is the incremental size(this column is represented by the sum of all state handles, but the PlaceholderStreamStateHandle, used in incremental, always return 0 when calling getStateSize()) 2. for the second question, maybe we need to dig it deeper to find out the reason. Best, Congxian Fabian Hueske <[hidden email]> 于2019年7月23日周二 下午6:28写道:
|
Re: How to read UI checkpoints section
|
Thanks for correcting me Congxian! I guess, we should rename "State Size" to "Checkpointed Data Size" or something like that to make it more clear. If the amount of checkpointed data grows, checkpointing will simply take more time. Nonetheless, 38 minutes for 100GB seems not right. Cheers, Fabian Am Di., 23. Juli 2019 um 17:12 Uhr schrieb Congxian Qiu <[hidden email]>:
|
|
Hi Fabian,
Several months ago, for some internal purpose (monitor the overall state size as one of the factors to decide whether to scale up/down). We add a new method named #getFullStateSize() in AbstractCheckpointStats to return the overall state size in our internal
Flink. This would have to add similar methods to OperatorSubtaskState, SubtaskStateStats, StateObjectCollection and so on. It seems not every developer could know the exact meaning of state size changed when executing incremental checkpoints. I just create
a issue
https://issues.apache.org/jira/browse/FLINK-13390 to track this problem.
For Andrea's question, if your job come across really high back pressure or process elements really slowly. The checkpoint barrier of all channels can not be sent to downstream, which might explain why your 'Buffered during alighment' did not change much compared
to the checkpoint duration increase.
Best
Yun Tang
From: Fabian Hueske <[hidden email]>
Sent: Tuesday, July 23, 2019 23:45 To: Congxian Qiu <[hidden email]> Cc: Andrea Spina <[hidden email]>; user <[hidden email]> Subject: Re: How to read UI checkpoints section Thanks for correcting me Congxian!
I guess, we should rename "State Size" to "Checkpointed Data Size" or something like that to make it more clear.
If the amount of checkpointed data grows, checkpointing will simply take more time.
Nonetheless, 38 minutes for 100GB seems not right.
Cheers, Fabian
Am Di., 23. Juli 2019 um 17:12 Uhr schrieb Congxian Qiu <[hidden email]>:
|
«
Return to (DEPRECATED) Apache Flink User Mailing List archive.
|
1 view|%1 views
| Free forum by Nabble | Edit this page |


