How can I visualize the metrics Counter and Meter at VisualVM?
How can I visualize the metrics Counter and Meter at VisualVM?
|
Hi, I have configured JMXReporter on Flink. I have a RichMapFunction class emitting a counter and a meter. When I open VisualVM and the MBeans tab I can only see the default metrics of Flink JobManager and Flink TaskManager. How can I see the metrics of my Meter and Counter? metrics.reporter.jmx.class: org.apache.flink.metrics.jmx.JMXReporter metrics.reporter.jmx.host: 192.168.56.1 metrics.reporter.jmx.port: 8789-8790 metrics.reporter.jmx.interval: 30 SECONDS Thanks, Felipe |
Re: How can I visualize the metrics Counter and Meter at VisualVM?
|
Did you explicitly connector to the
specific host/port, or just to a local process?
(If you specify a port, you must connect to the specific port) On 29/03/2019 15:25, Felipe Gutierrez wrote:
|
Re: How can I visualize the metrics Counter and Meter at VisualVM?
|
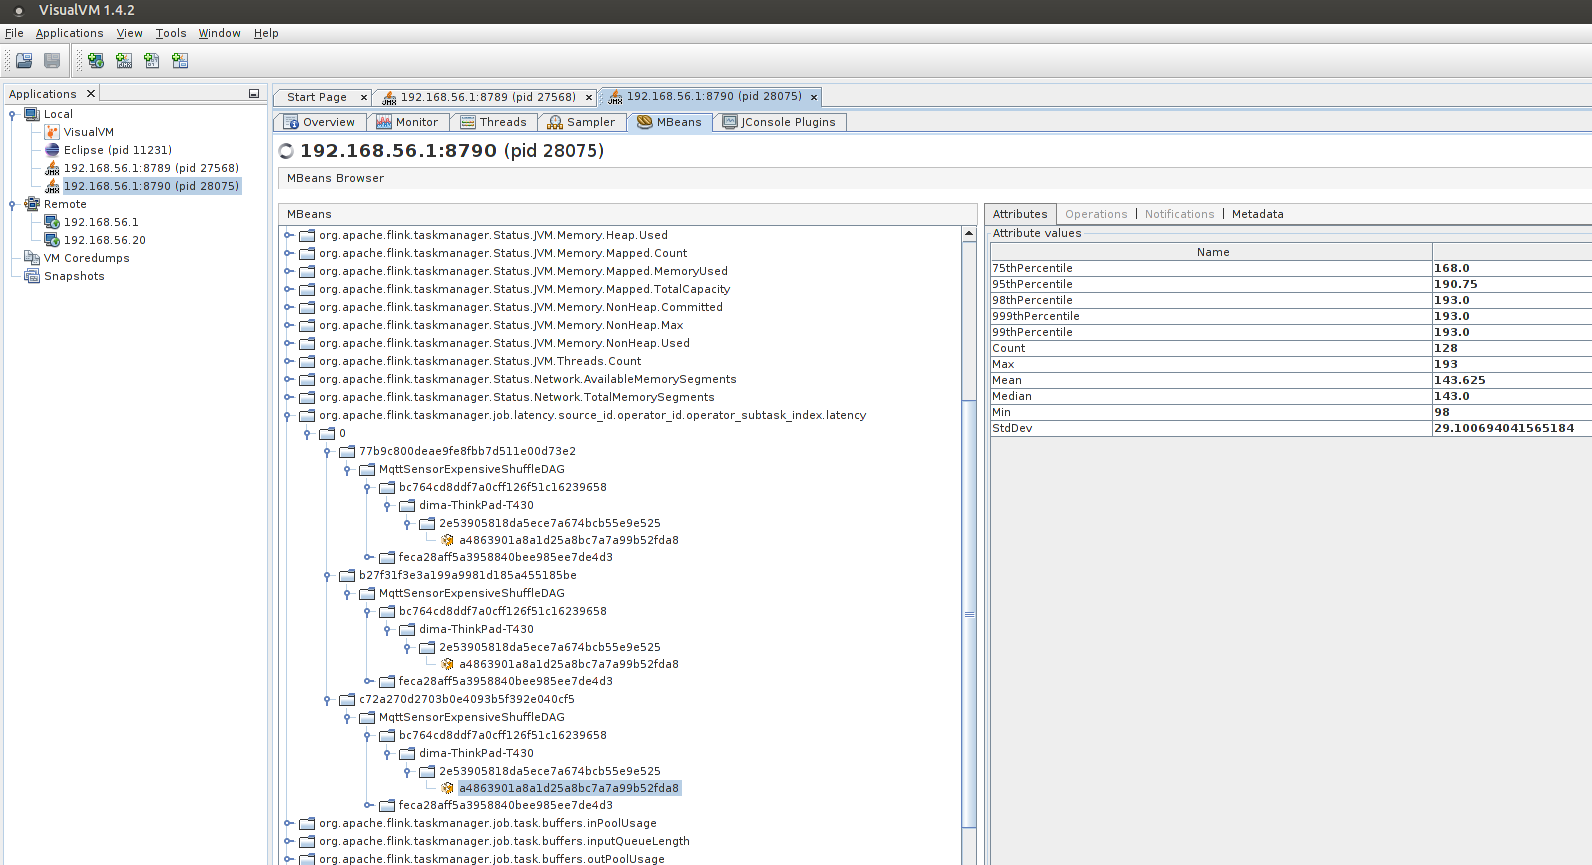
I realized that I can see the Meter that I defined. However I was expecting to see it by the name that I gave. And also a chart like in Graphite or here (https://flink.apache.org/news/2019/02/25/monitoring-best-practices.html). The screenshot shows how I am currently able to visualize it.  On Fri, Mar 29, 2019 at 3:31 PM Chesnay Schepler <[hidden email]> wrote:
|
«
Return to (DEPRECATED) Apache Flink User Mailing List archive.
|
1 view|%1 views
| Free forum by Nabble | Edit this page |

