How can I prove ....
|
That all nodes in a Flink Cluster are involved simultaneously in processing the data? Programmatically, graphically... I need to stress CPU , MEM and all resources to their max. How can I guarantee this is happening in Flink Cluster? Out of 4 nodes, this is the highest resource usage I see from "top"... Everything else is not even close... t op - 22:22:45 up 41 days, 2:39, 1 user, load average: 1.76, 1.55, 1.28 Tasks: 344 total, 1 running, 343 sleeping, 0 stopped, 0 zombie %Cpu(s): 5.4 us, 1.0 sy, 0.0 ni, 93.5 id, 0.1 wa, 0.0 hi, 0.0 si, 0.0 st KiB Mem: 11551564+total, 65702020 used, 49813632 free, 115072 buffers KiB Swap: 0 total, 0 used, 0 free. 3148420 cached Mem I am pretty sure I can push FlinkRunner to way more extent than this.... And thats where true realistic perf numbers start showing up. Thanks+regards, Amir- |
|
Hi, depending on the data source you might not be able to stress CPU/MEM because the source might be to slow. As long as you see the numbers increasing in the Flink Dashboard for all operators you should be good. Cheers, Aljoscha On Thu, 22 Sep 2016 at 00:26 amir bahmanyari <[hidden email]> wrote:
|
|
Thanks Aljoscha, Thats why I am wondering about this. I dont see send/receive columns change at all....just 0's all the time. The only thing that changes is time stamp. Is this an indication that the nodes in the cluster are not participating in execution of the data? Thanks again. Amir- From: Aljoscha Krettek <[hidden email]> To: amir bahmanyari <[hidden email]>; User <[hidden email]> Sent: Thursday, September 22, 2016 5:01 AM Subject: Re: How can I prove .... Hi, depending on the data source you might not be able to stress CPU/MEM because the source might be to slow. As long as you see the numbers increasing in the Flink Dashboard for all operators you should be good. Cheers, Aljoscha On Thu, 22 Sep 2016 at 00:26 amir bahmanyari <[hidden email]> wrote:
|
|
Hi Again, following is from the dashboard while wverything is supposedlt running. No real-time change in send/received/#of records...but one node is definitely producing a *.out file... And all TMs are reporting in their *.log files. And the process will eventually end , but very slow. Thanks again Aljoscha.  From: amir bahmanyari <[hidden email]> To: Aljoscha Krettek <[hidden email]>; User <[hidden email]> Sent: Thursday, September 22, 2016 9:16 AM Subject: Re: How can I prove .... Thanks Aljoscha, Thats why I am wondering about this. I dont see send/receive columns change at all....just 0's all the time. The only thing that changes is time stamp. Is this an indication that the nodes in the cluster are not participating in execution of the data? Thanks again. Amir- From: Aljoscha Krettek <[hidden email]> To: amir bahmanyari <[hidden email]>; User <[hidden email]> Sent: Thursday, September 22, 2016 5:01 AM Subject: Re: How can I prove .... Hi, depending on the data source you might not be able to stress CPU/MEM because the source might be to slow. As long as you see the numbers increasing in the Flink Dashboard for all operators you should be good. Cheers, Aljoscha On Thu, 22 Sep 2016 at 00:26 amir bahmanyari <[hidden email]> wrote:
|
|
Hi Again & sorry to take your time. But am puzzled by what I cannot explain why. The parallelism is set to 448. There are 112 tasks per TM. Why is Flink NOT allocating ALL 448 slots? It allocates only 1/2 of it. I also bumped up the # buffers to equate a 2GiB in each TM & see no difference :-( So I incremented my total-slots = 448. Kafka topic also has 448 partitions. Why am I having such a bad luck with this!!!!!!!??? LOL!! Thanks for your attention Aljoscha.  From: amir bahmanyari <[hidden email]> To: Aljoscha Krettek <[hidden email]>; User <[hidden email]> Sent: Thursday, September 22, 2016 10:10 AM Subject: Re: How can I prove .... Hi Again, following is from the dashboard while wverything is supposedlt running. No real-time change in send/received/#of records...but one node is definitely producing a *.out file... And all TMs are reporting in their *.log files. And the process will eventually end , but very slow. Thanks again Aljoscha.  From: amir bahmanyari <[hidden email]> To: Aljoscha Krettek <[hidden email]>; User <[hidden email]> Sent: Thursday, September 22, 2016 9:16 AM Subject: Re: How can I prove .... Thanks Aljoscha, Thats why I am wondering about this. I dont see send/receive columns change at all....just 0's all the time. The only thing that changes is time stamp. Is this an indication that the nodes in the cluster are not participating in execution of the data? Thanks again. Amir- From: Aljoscha Krettek <[hidden email]> To: amir bahmanyari <[hidden email]>; User <[hidden email]> Sent: Thursday, September 22, 2016 5:01 AM Subject: Re: How can I prove .... Hi, depending on the data source you might not be able to stress CPU/MEM because the source might be to slow. As long as you see the numbers increasing in the Flink Dashboard for all operators you should be good. Cheers, Aljoscha On Thu, 22 Sep 2016 at 00:26 amir bahmanyari <[hidden email]> wrote:
|
|
Are you sure you have the parallelism set to 448? You can see the parallelism of operators in the web UI.
On Fri, Sep 23, 2016 at 12:15 AM, amir bahmanyari <[hidden email]> wrote:
|
|
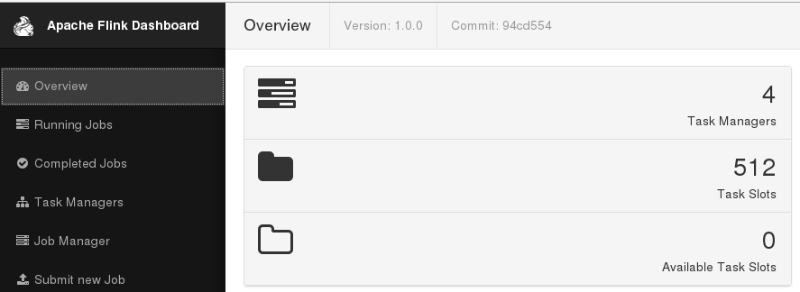
Hi Stephan, Currently running with 512 slots all taken as indicated by the dashboard. Are we talking about this? Then yes based on no available slots, I assume I am at 512 . Thanks & regards, Amir-  From: Stephan Ewen <[hidden email]> To: [hidden email]; amir bahmanyari <[hidden email]> Cc: Aljoscha Krettek <[hidden email]> Sent: Friday, September 23, 2016 6:32 AM Subject: Re: How can I prove .... Are you sure you have the parallelism set to 448? You can see the parallelism of operators in the web UI. On Fri, Sep 23, 2016 at 12:15 AM, amir bahmanyari <[hidden email]> wrote:
|
|
Hi Amir,
On 23 Sep 2016, at 19:57, amir bahmanyari <[hidden email]> wrote: > Currently running with 512 slots all taken as indicated by the dashboard. > Are we talking about this? Then yes based on no available slots, I assume I am at 512 . I guess Stephan is referring to the parallelism of single operators as displayed in the operator graph, see e.g. https://ci.apache.org/projects/flink/flink-docs-release-0.10/page/img/webclient_plan_view.png . Regards, Felix |
|
Thanks Felix. Interesting. I tried to create the JASON but didnt work according to the sample code I found in docs. There is a way to get the same JASON from the command line. Is there an example? Thanks+regards Amir- From: Felix Dreissig <[hidden email]> To: amir bahmanyari <[hidden email]> Cc: [hidden email] Sent: Saturday, September 24, 2016 8:18 AM Subject: Re: How can I prove .... Hi Amir, On 23 Sep 2016, at 19:57, amir bahmanyari <[hidden email]> wrote: > Currently running with 512 slots all taken as indicated by the dashboard. > Are we talking about this? Then yes based on no available slots, I assume I am at 512 . I guess Stephan is referring to the parallelism of single operators as displayed in the operator graph, see e.g. https://ci.apache.org/projects/flink/flink-docs-release-0.10/page/img/webclient_plan_view.png . Regards, Felix |
|
You do not need to create any JSON. Just click on "Running Jobs" in the UI, and then on the job. The parallelism is shown as a number in the boxes of the graph. On Sat, Sep 24, 2016 at 6:28 PM, amir bahmanyari <[hidden email]> wrote:
|
|
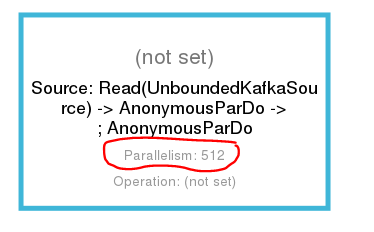
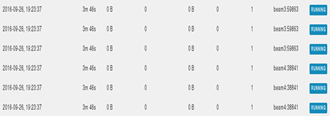
Thanks Stephan. I dont see a "graph" in JM's "Dashboard" when I click on the running job...I see a box like below with Parallelism = 512 which is what I have set as the parallelism degree in my code: options.setParallelism(512); Does this mean the cluster is now fully running on its max capacity?  Interesting enough, there is no change in Send/Received columns of the Running slots in the servers below: all zeros all the time... But, its says "Running" as per each server's configured slots which totals to 512. Just no dynamic data being presented here although the data is actually being processed for sure. Shouldnt they dynamically change as data is being processed?  Thanks+regards Amir- From: Stephan Ewen <[hidden email]> To: [hidden email]; amir bahmanyari <[hidden email]> Cc: Felix Dreissig <[hidden email]> Sent: Monday, September 26, 2016 2:18 AM Subject: Re: How can I prove .... You do not need to create any JSON. Just click on "Running Jobs" in the UI, and then on the job. The parallelism is shown as a number in the boxes of the graph. On Sat, Sep 24, 2016 at 6:28 PM, amir bahmanyari <[hidden email]> wrote:
|
|
In reply to this post by Stephan Ewen
Hi Stephan, This is from the dashboard. Total Parallelism is set = 1024. 259 tasks per TM. all say Running, but I get *.out log in beam4 server only (bottom of the servers list). Does this mean that all nodes are engaged in processing the data? Why are these encircled columns having 0's for their data exchange report? Thanks+regards, Amir-  From: Stephan Ewen <[hidden email]> To: [hidden email]; amir bahmanyari <[hidden email]> Cc: Felix Dreissig <[hidden email]> Sent: Monday, September 26, 2016 2:18 AM Subject: Re: How can I prove .... You do not need to create any JSON. Just click on "Running Jobs" in the UI, and then on the job. The parallelism is shown as a number in the boxes of the graph. On Sat, Sep 24, 2016 at 6:28 PM, amir bahmanyari <[hidden email]> wrote:
|
«
Return to (DEPRECATED) Apache Flink User Mailing List archive.
|
1 view|%1 views
| Free forum by Nabble | Edit this page |


