GC too frequently?


|
Hi,
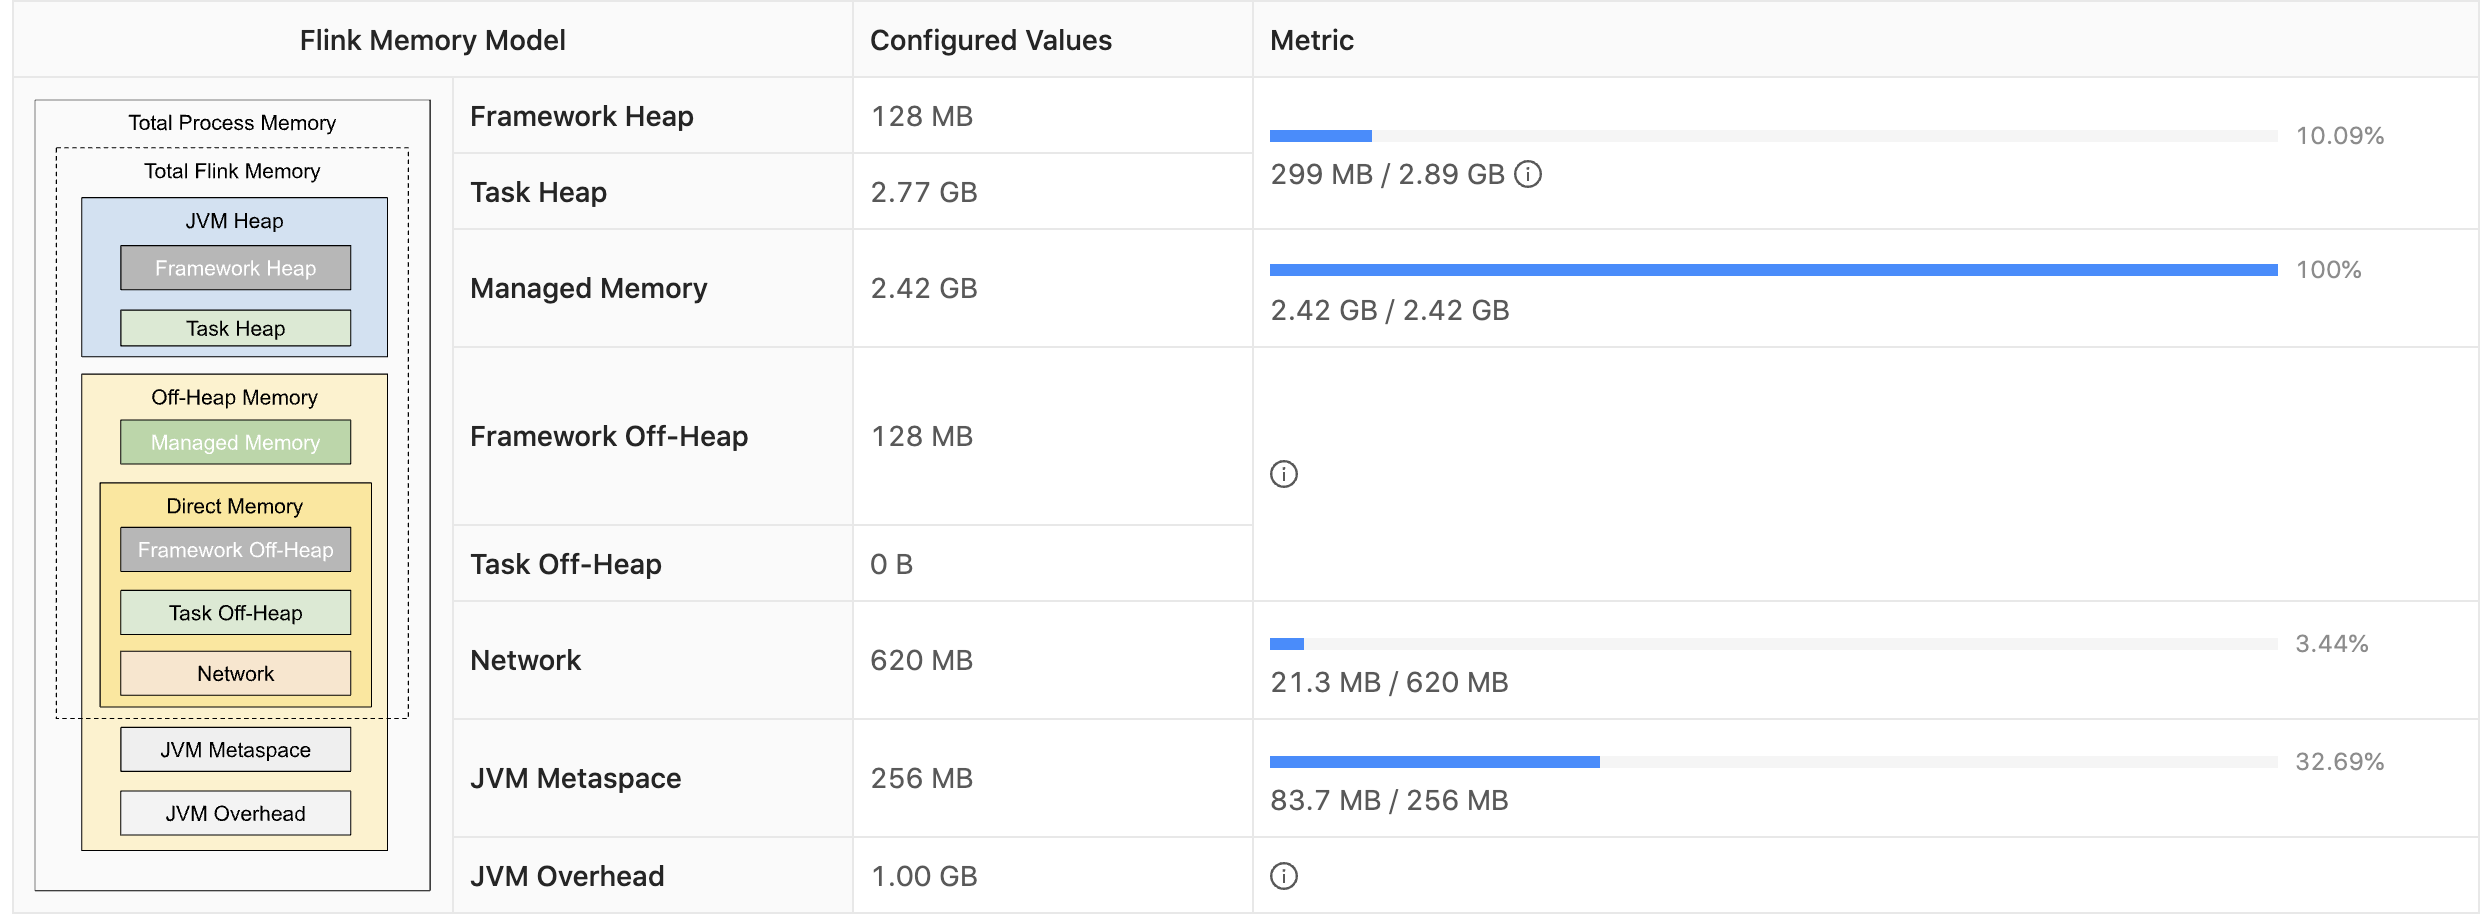
I'm looking at the GC logs from one of our jobs and it looks like it's doing GC very frequently (like once every a couple of seconds). Please refer to the excerpt of the log below. I'm just wondering if this is an indication that we might have some memory optimization we could do here. We are using RocksDb as our state backend. Is it possible this frequent GC is caused by RocksDb? Also, I noticed the same job has a configured Managed Memory to be 2.42GB and it's always 100% occupied. Is this normal?  Thanks. Thomas GC Log Excerpt 2021-06-18T05:48:58.042+0000: 14040.140: Total time for which application threads were stopped: 0.0255232 seconds, Stopping threads took: 0.0000690 seconds 2021-06-18T05:49:00.694+0000: 14042.792: [GC (Allocation Failure) [PSYoungGen: 996160K->16192K(996864K)] 1250225K->271313K(3024384K), 0.0222628 secs] [Times: user=0.12 sys=0.01, real=0.02 secs] 2021-06-18T05:49:00.716+0000: 14042.815: Total time for which application threads were stopped: 0.0228381 seconds, Stopping threads took: 0.0001292 seconds 2021-06-18T05:49:03.400+0000: 14045.498: [GC (Allocation Failure) [PSYoungGen: 996160K->16480K(996864K)] 1251281K->272585K(3024384K), 0.0187810 secs] [Times: user=0.08 sys=0.01, real=0.02 secs] 2021-06-18T05:49:03.418+0000: 14045.517: Total time for which application threads were stopped: 0.0192588 seconds, Stopping threads took: 0.0000801 seconds 2021-06-18T05:49:03.419+0000: 14045.518: Total time for which application threads were stopped: 0.0003514 seconds, Stopping threads took: 0.0000749 seconds 2021-06-18T05:49:06.165+0000: 14048.264: [GC (Allocation Failure) [PSYoungGen: 996448K->16608K(996864K)] 1252553K->273721K(3024384K), 0.0319802 secs] [Times: user=0.10 sys=0.00, real=0.03 secs] 2021-06-18T05:49:06.197+0000: 14048.296: Total time for which application threads were stopped: 0.0406701 seconds, Stopping threads took: 0.0082208 seconds 2021-06-18T05:49:08.800+0000: 14050.899: [GC (Allocation Failure) [PSYoungGen: 996576K->16544K(995840K)] 1253689K->274713K(3023360K), 0.0213845 secs] [Times: user=0.11 sys=0.00, real=0.02 secs] 2021-06-18T05:49:08.822+0000: 14050.921: Total time for which application threads were stopped: 0.0218467 seconds, Stopping threads took: 0.0000852 seconds 2021-06-18T05:49:11.437+0000: 14053.536: [GC (Allocation Failure) [PSYoungGen: 995488K->16352K(996352K)] 1253657K->275657K(3023872K), 0.0165518 secs] [Times: user=0.09 sys=0.00, real=0.01 secs] 2021-06-18T05:49:11.454+0000: 14053.553: Total time for which application threads were stopped: 0.0170519 seconds, Stopping threads took: 0.0000875 seconds 2021-06-18T05:49:14.580+0000: 14056.679: [GC (Allocation Failure) [PSYoungGen: 995296K->16480K(996352K)] 1254601K->276849K(3023872K), 0.0258063 secs] [Times: user=0.14 sys=0.00, real=0.03 secs] 2021-06-18T05:49:14.606+0000: 14056.705: Total time for which application threads were stopped: 0.0262383 seconds, Stopping threads took: 0.0001178 seconds 2021-06-18T05:49:14.607+0000: 14056.706: Total time for which application threads were stopped: 0.0002851 seconds, Stopping threads took: 0.0000786 seconds 2021-06-18T05:49:17.928+0000: 14060.027: [GC (Allocation Failure) [PSYoungGen: 995424K->16672K(996352K)] 1255793K->278105K(3023872K), 0.0235542 secs] [Times: user=0.14 sys=0.00, real=0.02 secs] 2021-06-18T05:49:17.952+0000: 14060.051: Total time for which application threads were stopped: 0.0239318 seconds, Stopping threads took: 0.0000790 seconds 2021-06-18T05:49:21.181+0000: 14063.280: [GC (Allocation Failure) [PSYoungGen: 995616K->17024K(996352K)] 1257049K->279521K(3023872K), 0.0303763 secs] [Times: user=0.15 sys=0.00, real=0.03 secs] 2021-06-18T05:49:21.212+0000: 14063.311: Total time for which application threads were stopped: 0.0331694 seconds, Stopping threads took: 0.0024233 seconds 2021-06-18T05:49:24.594+0000: 14066.692: [GC (Allocation Failure) [PSYoungGen: 995968K->17216K(996352K)] 1258465K->280809K(3023872K), 0.0244004 secs] [Times: user=0.10 sys=0.00, real=0.03 secs] 2021-06-18T05:49:24.618+0000: 14066.717: Total time for which application threads were stopped: 0.0249433 seconds, Stopping threads took: 0.0000845 seconds 2021-06-18T05:49:24.619+0000: 14066.718: Total time for which application threads were stopped: 0.0003702 seconds, Stopping threads took: 0.0001738 seconds 2021-06-18T05:49:28.122+0000: 14070.221: [GC (Allocation Failure) [PSYoungGen: 996160K->17408K(994304K)] 1259753K->282137K(3021824K), 0.0224071 secs] [Times: user=0.09 sys=0.00, real=0.02 secs] 2021-06-18T05:49:28.144+0000: 14070.243: Total time for which application threads were stopped: 0.0228229 seconds, Stopping threads took: 0.0000549 seconds 2021-06-18T05:49:31.084+0000: 14073.183: [GC (Allocation Failure) [PSYoungGen: 994304K->16672K(995328K)] 1259033K->283601K(3022848K), 0.0252842 secs] [Times: user=0.14 sys=0.01, real=0.03 secs] 2021-06-18T05:49:31.109+0000: 14073.208: Total time for which application threads were stopped: 0.0257460 seconds, Stopping threads took: 0.0000919 seconds 2021-06-18T05:49:34.263+0000: 14076.362: [GC (Allocation Failure) [PSYoungGen: 993568K->18112K(994304K)] 1260497K->285041K(3021824K), 0.0225746 secs] [Times: user=0.13 sys=0.00, real=0.03 secs] 2021-06-18T05:49:34.285+0000: 14076.384: Total time for which application threads were stopped: 0.0231061 seconds, Stopping threads took: 0.0001042 seconds 2021-06-18T05:49:34.286+0000: 14076.385: Total time for which application threads were stopped: 0.0004580 seconds, Stopping threads took: 0.0002052 seconds 2021-06-18T05:49:37.701+0000: 14079.800: [GC (Allocation Failure) [PSYoungGen: 993984K->18400K(994304K)] 1260913K->286409K(3021824K), 0.0386144 secs] [Times: user=0.17 sys=0.00, real=0.04 secs] 2021-06-18T05:49:37.740+0000: 14079.839: Total time for which application threads were stopped: 0.0391467 seconds, Stopping threads took: 0.0001178 seconds 2021-06-18T05:49:41.083+0000: 14083.182: [GC (Allocation Failure) [PSYoungGen: 994272K->18656K(994304K)] 1262281K->287841K(3021824K), 0.0238960 secs] [Times: user=0.14 sys=0.00, real=0.03 secs] 2021-06-18T05:49:41.107+0000: 14083.206: Total time for which application threads were stopped: 0.0243279 seconds, Stopping threads took: 0.0000477 seconds 2021-06-18T05:49:44.218+0000: 14086.317: [GC (Allocation Failure) [PSYoungGen: 993504K->18816K(993792K)] 1262689K->289145K(3021312K), 0.0263257 secs] [Times: user=0.13 sys=0.01, real=0.02 secs] 2021-06-18T05:49:44.244+0000: 14086.343: Total time for which application threads were stopped: 0.0267741 seconds, Stopping threads took: 0.0000556 seconds 2021-06-18T05:49:44.245+0000: 14086.344: Total time for which application threads were stopped: 0.0003007 seconds, Stopping threads took: 0.0001138 seconds 2021-06-18T05:49:47.656+0000: 14089.755: [GC (Allocation Failure) [PSYoungGen: 993664K->19104K(992768K)] 1263993K->290553K(3020288K), 0.0235784 secs] [Times: user=0.15 sys=0.00, real=0.03 secs] 2021-06-18T05:49:47.679+0000: 14089.778: Total time for which application threads were stopped: 0.0239409 seconds, Stopping threads took: 0.0000432 seconds 2021-06-18T05:49:51.161+0000: 14093.260: [GC (Allocation Failure) [PSYoungGen: 991904K->19296K(992256K)] 1263353K->291905K(3019776K), 0.0169079 secs] [Times: user=0.08 sys=0.00, real=0.02 secs] 2021-06-18T05:49:51.178+0000: 14093.277: Total time for which application threads were stopped: 0.0177695 seconds, Stopping threads took: 0.0002586 seconds 2021-06-18T05:49:54.320+0000: 14096.418: [GC (Allocation Failure) [PSYoungGen: 992096K->19424K(991744K)] 1264705K->293209K(3019264K), 0.0140439 secs] [Times: user=0.07 sys=0.00, real=0.01 secs] 2021-06-18T05:49:54.334+0000: 14096.433: Total time for which application threads were stopped: 0.0144483 seconds, Stopping threads took: 0.0000471 seconds 2021-06-18T05:49:54.334+0000: 14096.433: Total time for which application threads were stopped: 0.0003035 seconds, Stopping threads took: 0.0001137 seconds 2021-06-18T05:49:57.246+0000: 14099.345: [GC (Allocation Failure) [PSYoungGen: 990176K->19840K(992256K)] 1263961K->294633K(3019776K), 0.0283044 secs] [Times: user=0.15 sys=0.00, real=0.02 secs] 2021-06-18T05:49:57.274+0000: 14099.373: Total time for which application threads were stopped: 0.0289437 seconds, Stopping threads took: 0.0000899 seconds 2021-06-18T05:50:00.688+0000: 14102.787: [GC (Allocation Failure) [PSYoungGen: 990592K->20288K(991232K)] 1265385K->296057K(3018752K), 0.0377138 secs] [Times: user=0.15 sys=0.00, real=0.04 secs] 2021-06-18T05:50:00.726+0000: 14102.825: Total time for which application threads were stopped: 0.0385988 seconds, Stopping threads took: 0.0004735 seconds 2021-06-18T05:50:04.082+0000: 14106.181: [GC (Allocation Failure) [PSYoungGen: 990016K->20448K(990208K)] 1265785K->297297K(3017728K), 0.0258632 secs] [Times: user=0.13 sys=0.00, real=0.03 secs] 2021-06-18T05:50:04.108+0000: 14106.207: Total time for which application threads were stopped: 0.0263638 seconds, Stopping threads took: 0.0000775 seconds 2021-06-18T05:50:04.108+0000: 14106.207: Total time for which application threads were stopped: 0.0002315 seconds, Stopping threads took: 0.0000668 seconds 2021-06-18T05:50:07.057+0000: 14109.156: [GC (Allocation Failure) [PSYoungGen: 990176K->20448K(990208K)] 1267025K->298633K(3017728K), 0.0208241 secs] [Times: user=0.12 sys=0.00, real=0.02 secs] 2021-06-18T05:50:07.078+0000: 14109.177: Total time for which application threads were stopped: 0.0212426 seconds, Stopping threads took: 0.0000922 seconds 2021-06-18T05:50:10.521+0000: 14112.620: [GC (Allocation Failure) [PSYoungGen: 988128K->20384K(990720K)] 1266313K->299929K(3018240K), 0.0350130 secs] [Times: user=0.16 sys=0.01, real=0.03 secs] 2021-06-18T05:50:10.556+0000: 14112.655: Total time for which application threads were stopped: 0.0383657 seconds, Stopping threads took: 0.0029498 seconds 2021-06-18T05:50:13.889+0000: 14115.988: [GC (Allocation Failure) [PSYoungGen: 988064K->20320K(989696K)] 1267609K->301169K(3017216K), 0.0368907 secs] [Times: user=0.17 sys=0.01, real=0.04 secs] 2021-06-18T05:50:13.926+0000: 14116.025: Total time for which application threads were stopped: 0.0373157 seconds, Stopping threads took: 0.0000591 seconds 2021-06-18T05:50:13.932+0000: 14116.031: Total time for which application threads were stopped: 0.0003081 seconds, Stopping threads took: 0.0000660 seconds 2021-06-18T05:50:16.999+0000: 14119.098: [GC (Allocation Failure) [PSYoungGen: 986976K->20288K(990208K)] 1267825K->302521K(3017728K), 0.0340578 secs] [Times: user=0.18 sys=0.01, real=0.03 secs] 2021-06-18T05:50:17.033+0000: 14119.132: Total time for which application threads were stopped: 0.0344908 seconds, Stopping threads took: 0.0000879 seconds 2021-06-18T05:50:20.266+0000: 14122.365: [GC (Allocation Failure) [PSYoungGen: 986944K->20384K(990208K)] 1269177K->303993K(3017728K), 0.0283179 secs] [Times: user=0.13 sys=0.01, real=0.02 secs] 2021-06-18T05:50:20.294+0000: 14122.393: Total time for which application threads were stopped: 0.0287201 seconds, Stopping threads took: 0.0000619 seconds 2021-06-18T05:50:23.607+0000: 14125.706: [GC (Allocation Failure) [PSYoungGen: 987040K->20320K(990208K)] 1270649K->305313K(3017728K), 0.0307321 secs] [Times: user=0.13 sys=0.00, real=0.03 secs] 05: Total time for which application threads were stopped: 0.0461605 seconds, Stopping threads took: 0.0000482 seconds 2021-06-18T05:50:17.853+0000: 14119.953: [GC (Allocation Failure) [PSYoungGen: 990720K->19808K(992256K)] 1214583K->245039K(3019776K), 0.0153896 secs] [Times: user=0.07 sys=0.00, real=0.02 secs] 2021-06-18T05:50:17.869+0000: 14119.969: Total time for which application threads were stopped: 0.0219192 seconds, Stopping threads took: 0.0061624 seconds 2021-06-18T05:50:20.497+0000: 14122.597: [GC (Allocation Failure) [PSYoungGen: 990560K->19488K(992256K)] 1215791K->246103K(3019776K), 0.0236140 secs] [Times: user=0.13 sys=0.00, real=0.03 secs] 2021-06-18T05:50:20.520+0000: 14122.620: Total time for which application threads were stopped: 0.0239970 seconds, Stopping threads took: 0.0000650 seconds |
|
|
Another observation might be relevant is that the PS Scavenge Time (reported by Flink) is monotonically increasing. In the last 7 hours, this metric has increased from 0.003 sec to 0.012 sec. Thomas On Thu, Jun 17, 2021 at 11:15 PM Thomas Wang <[hidden email]> wrote:
|
|
|
In reply to this post by Thomas Wang
Hi Thomas, RocksDB mainly use the native memory (managed memory in flink memory model), which will not affect the GC. Nearly all managed memory will be assigned to RocksDB (check https://ci.apache.org/projects/flink/flink-docs-master/docs/deployment/memory/mem_setup_tm/#managed-memory) and managed by itself. Flink doesn't know the memory watermark inside the RocksDB. So it is normal that the managed memory is always 100% occupied. As for the GC log, I noticed that it is mainly about the young GC, and only take about 0.03 sec per 3 seconds. From my experience, it's no big deal. Best, Zakelly. Thomas Wang <[hidden email]> 于2021年6月18日周五 下午2:15写道:
|

|
|
Thanks Zakelly. Thomas On Thu, Jun 17, 2021 at 11:58 PM Zakelly Lan <[hidden email]> wrote:
|

|
|
Hi, Zakelly Sorry to ask a noob question, from what i understand, if scavenge GC time keeps increasing instead of being stable/decrease at some point, it means there is some potential memory leakage issue. The image below is taskmanager scavenge GC time over the last 12 hours. (The same job that Thomas runs), so now it is 0.4 seconds. Can you share your thoughts on this? Thank you. 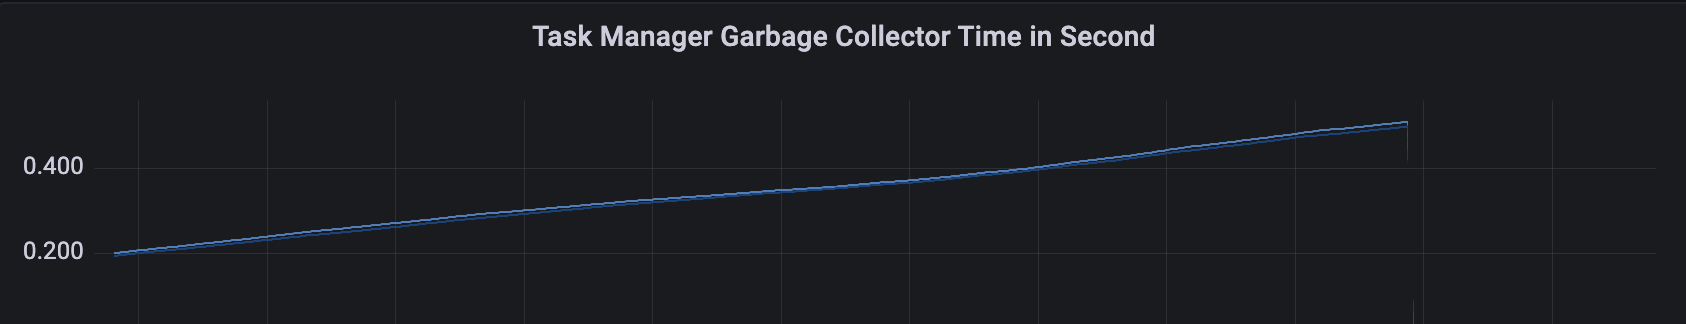 On Fri, Jun 18, 2021 at 9:23 AM Thomas Wang <[hidden email]> wrote:
Yours
Rommel ************************************* I waited patiently for the LORD; ************************************* |

«
Return to (DEPRECATED) Apache Flink User Mailing List archive.
|
1 view|%1 views
| Free forum by Nabble | Edit this page |