Flink memory consumption outside JVM on Kubernetes
Flink memory consumption outside JVM on Kubernetes
|
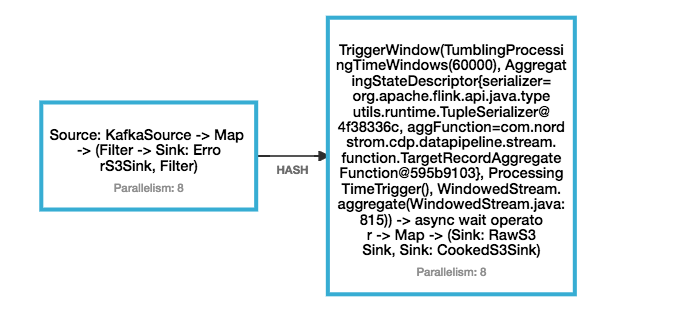
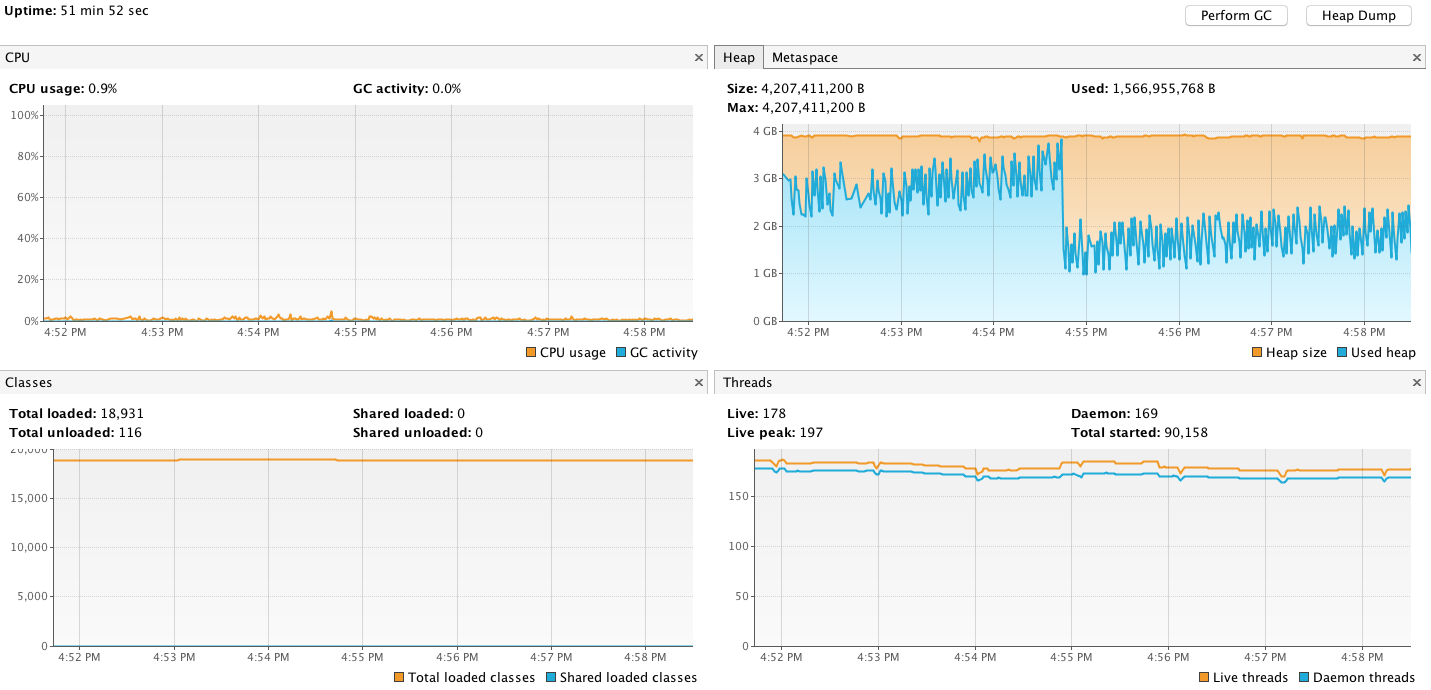
Hi All, We have a flink deployment where it consumes messages from Kafka topics in avro format, deserializes them, filters them(for null values), key them by (topic, event time and partition), time window for 60 second and finally aggregates them in avro format and parquet format and writes to S3 buckets. My flink chart looks like this:  I am running on flink with the following setup: jobmanager.rpc.address: flink-jobmanager.XCD.svc. jobmanager.rpc.port: 6123 jobmanager.heap.mb: 4096 jobmanager.web.port: 8081 jobmanager.web.upload.dir: /opt/flink/jars taskmanager.data.port: 6121 taskmanager.rpc.port: 6122 taskmanager.heap.mb: 4096 taskmanager.numberOfTaskSlots: 4 #taskmanager.memory. #taskmanager.memory.off-heap: true taskmanager.debug.memory. taskmanager.debug.memory. #taskmanager.network. blob.server.port: 6124 query.server.port: 6125 parallelism.default: 1 fs.hdfs.hadoopconf: /var/hadoop/conf/ state.backend: rocksdb state.backend.rocksdb. state.checkpoints.dir: s3a://cdp-flink-dev/ state.savepoints.dir: s3a://cdp-flink-dev/ state.backend.fs. high-availability: zookeeper high-availability.zookeeper. high-availability.zookeeper. high-availability.zookeeper. high-availability.zookeeper. #high-availability.zookeeper. high-availability.jobmanager. security.ssl.enabled: true jobmanager.web.ssl.enabled: true taskmanager.data.ssl.enabled: true blob.service.ssl.enabled: true akka.ssl.enabled: true metrics.reporters: jmx metrics.reporter.jmx.class: org.apache.flink.metrics.jmx. metrics.reporter.jmx_reporter. metrics.reporter.jmx.port: 9999 metrics.scope.jm: flink.<host>.jobmanager metrics.scope.jm.job: flink.<host>.jobmanager.<job_ metrics.scope.tm: flink.<host>.taskmanager.<tm_ metrics.scope.tm.job: flink.<host>.taskmanager.<tm_ metrics.scope.task: flink.<host>.taskmanager.<tm_ metrics.scope.operator: flink.<host>.taskmanager.<tm_ security.ssl.enabled: true security.ssl.keystore: /u01/app/cdp/var/secure/ security.ssl.keystore- security.ssl.key-password: xyz security.ssl.truststore: /u01/app/cdp/var/secure/flink_ security.ssl.truststore- security.ssl.verify-hostname: false env.java.opts: -XX:GCTimeRatio=19 -XX:MinHeapFreeRatio=20 -XX:MaxHeapFreeRatio=30 -XX:+ This setup seems to run fine on EC2 servers without any issues but on kubernetes the pods seems to crash(Out of memory(OOM) killed). I have tried setting openjdk memory to take cgroup memory(using flag UseCGroupMemoryLimitForHeap) but its of no avail. I have also tried changing checkpointing from rocksdb to filesystem and finally disabling but it still doesnt explain the OOM kill of pods. MY JMX metrics:  Grafana pod metrics:  Apart from the env. opts and inspecting the memory, I couldn't really get to the root of this issue. Any suggestions or help, thanks! Regards
Shashank Surya |
«
Return to (DEPRECATED) Apache Flink User Mailing List archive.
|
1 view|%1 views
| Free forum by Nabble | Edit this page |

