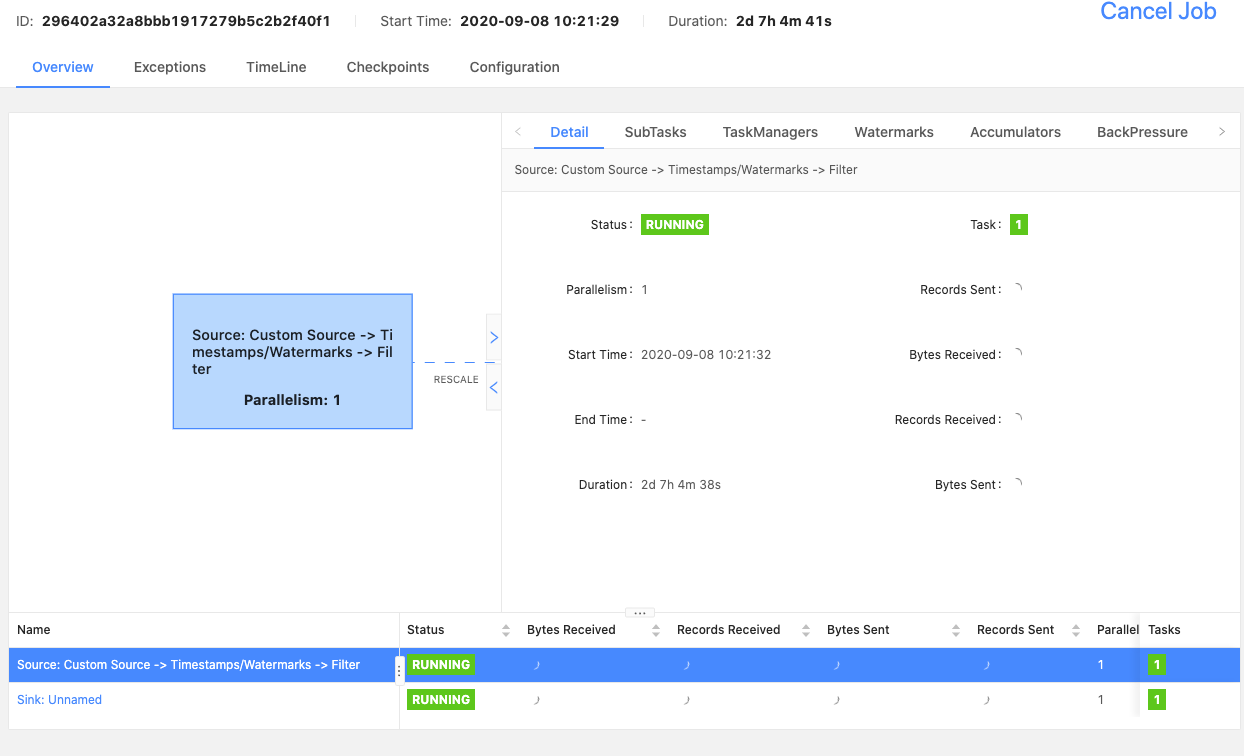
Flink UI not displaying records received/sent metrics
|
We are running a Flink 1.11.0 job cluster on Kubernetes. We're not seeing any metrics in the Flink Web UI (for the default metrics like Bytes Received, Records Received, etc.), instead we see a spinner. See image below. However, we have a prometheus metrics exporter configured and see job/task metrics in Prometheus.  Looking into the network tab, for requests that retrieve those metrics, we see GET /jobs/296402a32a8bbb1917279b5c2b2f40f1/vertices/cbc357ccb763df2852fee8c4fc7d55f2/watermarks The response is an empty array if I do this via CURL GET /jobs/296402a32a8bbb1917279b5c2b2f40f1/vertices/cbc357ccb763df2852fee8c4fc7d55f2 I get back { "id": "cbc357ccb763df2852fee8c4fc7d55f2", "name": "Source: Custom Source -> Timestamps/Watermarks -> Filter", "now": 1599776105604, "parallelism": 1, "subtasks": Array[1][ { "attempt": 0, "duration": 197613130, "end-time": -1, "host": "100.96.18.38", "metrics": { "read-bytes": 0, "read-bytes-complete": false, "read-records": 0, "read-records-complete": false, "write-bytes": 0, "write-bytes-complete": false, "write-records": 0, "write-records-complete": false }, "start-time": 1599578492474, "start_time": 1599578492474, "status": "RUNNING", "subtask": 0, "taskmanager-id": "2eb0550f0d3bca170f76dd86f84843a0" } ] } Are we missing anything in our setup? Any insight would be greatly appreciated. Thanks |
|
Hi Prashant, My initial suspicion is that this is a problem in the UI or with the network connection from the browser to the Flink REST endpoints. Since you can access the metrics with "curl", Flink seems to do everything all right. The first URL you posted is for the watermarks (it ends with "/watermarks"). Can you make sure that the URL you check in the browser is the same as you've checked with "curl"? How are you connecting into your Kubernetes cluster from your machine? (kubectl proxy?) Best, Robert On Fri, Sep 11, 2020 at 5:19 PM Prashant Nayak <[hidden email]> wrote:
|
«
Return to (DEPRECATED) Apache Flink User Mailing List archive.
|
1 view|%1 views
| Free forum by Nabble | Edit this page |


