Flink Metrics - PrometheusReporter
Flink Metrics - PrometheusReporter
|
Hey,
I've been trying to use the PrometheusReporter and when I used in locally on my computer, I would access the port I configured and see all the metrics I've created.
In production, we use High Availability mode and when I try to access the JobManager's metrics in the port I've configured on the PrometheusReporter, I see some very basic metrics - default Flink metrics, but I
can't see any of my custom metrics.
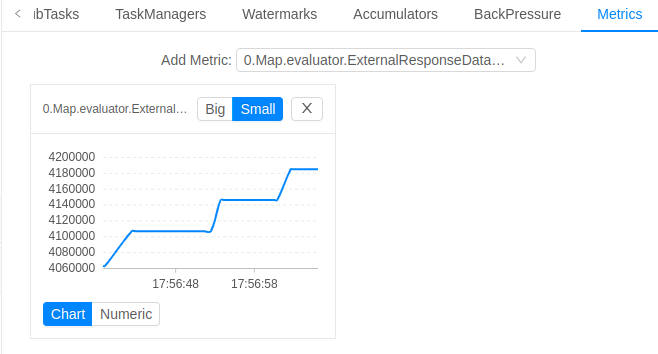
Weird thing is I can see those metrics through Flink's UI in the Metrics tab:

Does anybody have a clue why my custom metrics are configured but not being reported in high availability but are reported when I run the job locally though
IntelliJ?
Thanks
🙂
Sidney Feiner / Data
Platform Developer
M: +972.528197720 / Skype: sidney.feiner.startapp
|
Re: Flink Metrics - PrometheusReporter
|
Metrics are exposed via reporters by
each process separately, whereas the WebUI aggregates metrics.
As such you have to configure
Prometheus to also scrape the TaskExecutors.
On 22/01/2020 16:58, Sidney Feiner
wrote:
|
Re: Flink Metrics - PrometheusReporter
|
Ok, I configured the PrometheusReporter's ports to be a range and now every TaskManager has it's own port where I can see it's metrics. Thank you very much!
Sidney Feiner / Data
Platform Developer
M: +972.528197720 / Skype: sidney.feiner.startapp
From: Chesnay Schepler <[hidden email]>
Sent: Wednesday, January 22, 2020 6:07 PM To: Sidney Feiner <[hidden email]>; [hidden email] <[hidden email]> Subject: Re: Flink Metrics - PrometheusReporter Metrics are exposed via reporters by each process separately, whereas the WebUI aggregates metrics.
As such you have to configure Prometheus to also scrape the TaskExecutors.
On 22/01/2020 16:58, Sidney Feiner wrote:
|
«
Return to (DEPRECATED) Apache Flink User Mailing List archive.
|
1 view|%1 views
| Free forum by Nabble | Edit this page |


