Flink Metrics - InfluxDB + Grafana | Help with query influxDB query for Grafana to plot 'numRecordsIn' & 'numRecordsOut' for each operator/operation
Flink Metrics - InfluxDB + Grafana | Help with query influxDB query for Grafana to plot 'numRecordsIn' & 'numRecordsOut' for each operator/operation
|
Hi All,
I'm trying to plot the flink application metrics using grafana backed by influxdb. I need to plot/monitor the 'numRecordsIn' & 'numRecordsOut' for each operator/operation. I'm finding it hard to generate the influxdb query in grafana which can help me make this plot. I am able to plot the 'numRecordsIn' & 'numRecordsOut' for each subtask(parallelism set to 50) of the operator but not the operator as a whole. If somebody has knowledge or has successfully implemented this kind of a plot on grafana backed by influxdb, please share with me the process/query to achieve the same. Below is the query which I have to monitor the 'numRecordsIn' & 'numRecordsOut' for each subtask SELECT derivative(sum("count"), 10s) FROM "numRecordsOut" WHERE "task_name" = 'Source: Reading from Kafka' AND "subtask_index" =~ /^$subtask$/ AND $timeFilter GROUP BY time(10s), "task_name" PS: $subtask is the templating variable that I'm using in order to have multiple subtask values. I have tried the 'All' option for this templating variable- This give me an incorrect plot showing me negative values while the individual selection of subtask values when selected from the templating variable drop down yields correct result. Thank you! Regards, Anchit |
Re: Flink Metrics - InfluxDB + Grafana | Help with query influxDB query for Grafana to plot 'numRecordsIn' & 'numRecordsOut' for each operator/operation
|
This works well for me. This will aggregate the data across all sub-task instances:
You can also plot each sub-task instance separately on the same graph by doing:
Or select just a single subtask instance by using:
I haven’t used the templating features much but this also seems to work fine and allows you to select an individual subtask_index or ‘all’ and it works as it should — summing across all subtasks when you select ‘all’.
On Fri, Oct 28, 2016 at 2:53 PM, Anchit Jatana <[hidden email]> wrote:
|
Re: Flink Metrics - InfluxDB + Grafana | Help with query influxDB query for Grafana to plot 'numRecordsIn' & 'numRecordsOut' for each operator/operation
|
Another note. In the example the template variable type is "custom" and the values have to be enumerated manually. So in your case you would have to configure all the possible values of "subtask" to be 0-49. On Tue, Nov 1, 2016 at 2:43 PM, Jamie Grier <[hidden email]> wrote:
|
Re: Flink Metrics - InfluxDB + Grafana | Help with query influxDB query for Grafana to plot 'numRecordsIn' & 'numRecordsOut' for each operator/operation
|
Ahh.. I haven’t used templating all that much but this also works for your substask variable so that you don’t have to enumerate all the possible values: Template Variable Type: query query: On Tue, Nov 1, 2016 at 2:51 PM, Jamie Grier <[hidden email]> wrote:
|
Re: Flink Metrics - InfluxDB + Grafana | Help with query influxDB query for Grafana to plot 'numRecordsIn' & 'numRecordsOut' for each operator/operation
|
This post was updated on .
Hi Jamie,
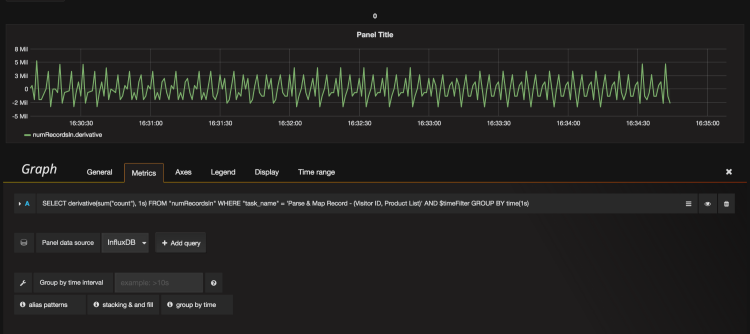
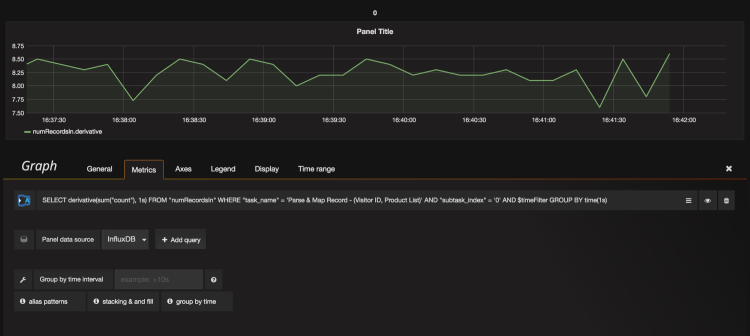
Thank you so much for your response. The below query: SELECT derivative(sum("count"), 1s) FROM "numRecordsIn" WHERE "task_name" = 'Sink: Unnamed' AND $timeFilter GROUP BY time(1s) behaves the same as with the use of the templating variable in the 'All' case i.e. shows a plots of junk 'negative values' It shows accurate results/plot when an additional where clause for "subtask_index" is applied to the query. But without the "subtask_index" where clause (which means for all the subtask_indexes) it shows some junk/incorrect values on the graph (both highly positive & highly negative values in orders of millions) Images: Incorrect_(for_all_subtasks):  Correct_(for_a_specific_subtask):  Regards, Anchit |
Re: Flink Metrics - InfluxDB + Grafana | Help with query influxDB query for Grafana to plot 'numRecordsIn' & 'numRecordsOut' for each operator/operation
|
Hmm. I can't recreate that behavior here. I have seen some issues like this if you're grouping by a time interval different from the metrics reporting interval you're using, though. How often are you reporting metrics to Influx? Are you using the same interval in your Grafana queries? I see in your queries you are using a time interval of 10 seconds. Have you tried 1 second? Do you see the same behavior? -Jamie On Tue, Nov 1, 2016 at 4:30 PM, Anchit Jatana <[hidden email]> wrote: Hi Jamie, |
Re: Flink Metrics - InfluxDB + Grafana | Help with query influxDB query for Grafana to plot 'numRecordsIn' & 'numRecordsOut' for each operator/operation
|
I've set the metric reporting frequency to InfluxDB as 10s. In the screenshot, I'm using Grafana query interval of 1s. I've tried 10s and more too, the graph shape changes a bit but the incorrect negative values are still plotted(makes no difference).
Something to add: If the subtasks are less than equal to 30, the same query yields correct results. For subtask index > 30 (for my case being 50) it plots junk negative and poistive values. Regards, Anchit |
Re: Flink Metrics - InfluxDB + Grafana | Help with query influxDB query for Grafana to plot 'numRecordsIn' & 'numRecordsOut' for each operator/operation
|
Hi Anchit, That last bit is very interesting - the fact that it works fine with subtasks <= 30. It could be that either Influx or Grafana are not able to keep up with the data being produced. I would guess that the culprit is Grafana if looking at any particular subtask index works fine and only the full aggregation shows issues. I'm not familiar enough with Grafana to know which parts of the queries are "pushed down" to the database and which are done in Grafana. This might also very by backend database. Anecdotally, I've also seen scenarios using Grafana and Influx together where the system seems to get overwhelmed fairly easily.. I suspect the Graphite/Grafana combo would work a lot better in production setups. This might be relevant: -Jamie On Tue, Nov 1, 2016 at 5:48 PM, Anchit Jatana <[hidden email]> wrote: I've set the metric reporting frequency to InfluxDB as 10s. In the |
Re: Flink Metrics - InfluxDB + Grafana | Help with query influxDB query for Grafana to plot 'numRecordsIn' & 'numRecordsOut' for each operator/operation
|
Hi Jamie,
Thanks for sharing your thoughts. I'll try and integrate with Graphite to see if this gets resolved. Regards, Anchit |
Re: Flink Metrics - InfluxDB + Grafana | Help with query influxDB query for Grafana to plot 'numRecordsIn' & 'numRecordsOut' for each operator/operation
|
Hi there,
I am using Graphite and querying it in Grafana is super easy. You just select fields and they come up automatically for you to select from depending on how your metric structure in Graphite looks like. You can also use wildcards. The only thing I had to do because I am also using containers to run my Flink components was to define a rather static naming for jobmanager and task managers so that I wouldn't have to many new entities in my graphs when I restart especially my task manager containers. Thanks Philipp |
| Free forum by Nabble | Edit this page |

