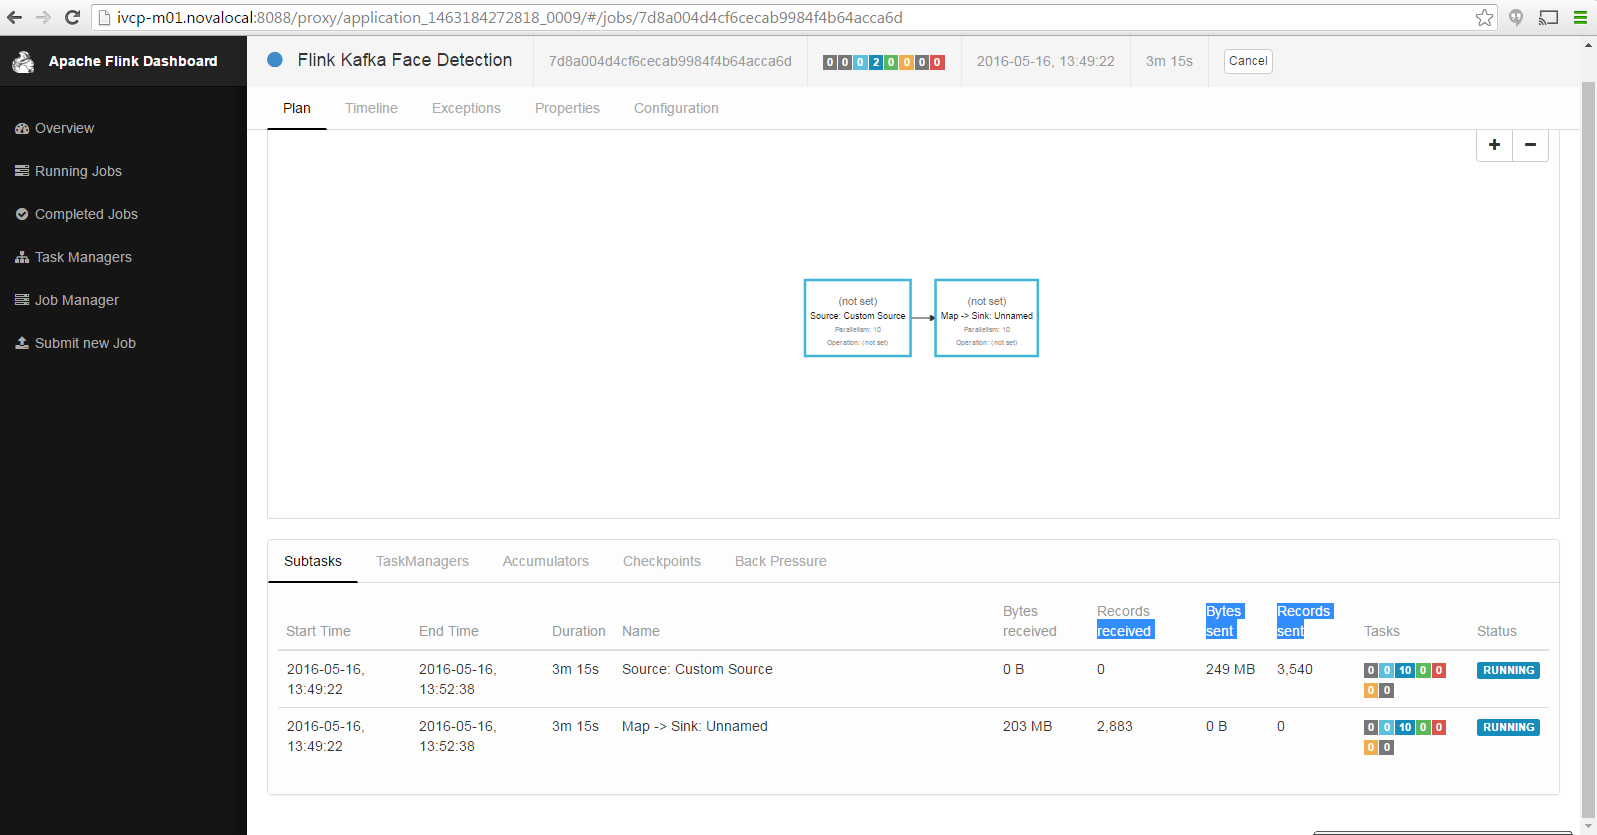
Flink Kafka Streaming - Source [Bytes/records Received] and Sink [Bytes/records sent] show zero messages
Flink Kafka Streaming - Source [Bytes/records Received] and Sink [Bytes/records sent] show zero messages
|
Hi
In my flink kafka streaming application i am fetching data from one topic and then process and sent to output topic . my application is working fine but flink dashboard shows Source [Bytes/records Received] and Sink [Bytes/records sent] is zero. Duration Name Bytes Records Bytes Records Status Received Received sent sent 3m 15s Source: Custom Source 0 B 0 249 MB 3,540 RUNNING 3m 15s Map -> Sink: Unnamed 203 MB 2,883 0 B 0 RUNNING  what is the reason for not showing correct number ? Regards Prateek |
Re: Flink Kafka Streaming - Source [Bytes/records Received] and Sink [Bytes/records sent] show zero messages
|
Hi Prateek, the missing numbers are an artifact from how the stats are collected.ATM, Flink does only collect these metrics for data which is sent over connections *between* Flink operators. Since sources and sinks connect to external systems (and not Flink operators), the dash board does not show receiving byte for sources and sent bytes for sinks. Best, Fabian 2016-05-16 23:02 GMT+02:00 prateekarora <[hidden email]>: Hi |
Re: Flink Kafka Streaming - Source [Bytes/records Received] and Sink [Bytes/records sent] show zero messages
|
thanks for the information . I want to collect some performance metrics like throughput , latency etc .thats why looking for these data to collect some information . how can i collect some performance data in flink ? Regards Prateek On Mon, May 16, 2016 at 2:32 PM, Fabian Hueske-2 [via Apache Flink User Mailing List archive.] <[hidden email]> wrote:
|
|
Hi, currently, Flink doesn't have code build in for throughput (rate) and latency measurements. Its a planned feature for the future and some first steps are done into that direction. Check out this code for measuring throughput: https://github.com/rmetzger/flink-state-watermarks/blob/master/src/main/java/com/dataartisans/utils/ThroughputLogger.java (It will log the rates to the log file) For the latency, I would attach timestamps to your records and measure the delay by comparing the timestamps to the current system time (make sure the clocks on all machines are in sync) On Mon, May 16, 2016 at 11:43 PM, prateekarora <[hidden email]> wrote:
|
«
Return to (DEPRECATED) Apache Flink User Mailing List archive.
|
1 view|%1 views
| Free forum by Nabble | Edit this page |

