Flink 1.9 measuring time taken by each operator in DataStream API
Flink 1.9 measuring time taken by each operator in DataStream API
|
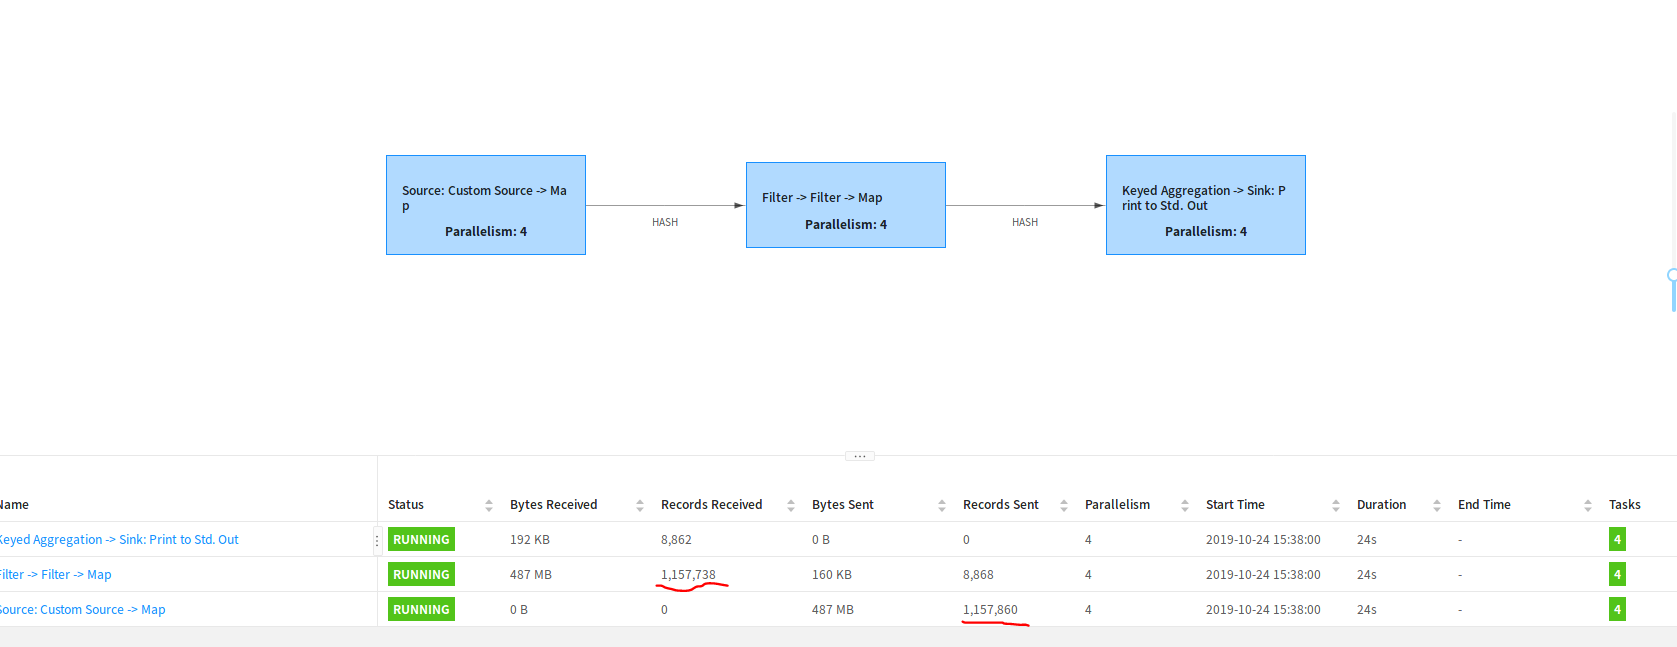
Hello, I have a few questions regarding flink’s dashboard and monitoring tools. I have a fixed number of records that I process through the datastreaming API on my standalone cluster and want to know how long it takes to process them. My questions are: 1) How can I see the time taken in milliseconds individually for each operator (filter, filter, map and keyed aggregate) to process these records during run time? I essentially want to know which operator causes the most latency in the pipeline. 2) While viewing the records and metrics on the dashboard there is a discrepancy between the number of records sent and received between two operators in my job graph. Why exactly are the number of records received by my second operator less than those sent by customsource->map and where are they stored? Image attached below for reference.  Best regards, Komal |
Re: Flink 1.9 measuring time taken by each operator in DataStream API
|
Hi Komal, Measuring latency is always a challenge. The problem here is that your functions are chained, meaning that the result of a function is directly passed on to the next function and only when the last function emits the result, the first function is called with a new record. This makes measuring the processing time of a single function difficult, because measuring the processing time of a single record is often not possible because the time for processing a single record is usually too small to be measured. Regarding the second point: Flink does not synchronize the collection of metrics because this would add too much overhead. In the given screenshot, some records might be still on the wire or waiting in buffers to be processed. Best, Fabian Am Do., 24. Okt. 2019 um 09:16 Uhr schrieb Komal Mariam <[hidden email]>:
|
| Free forum by Nabble | Edit this page |


