Diagnosing high cpu/memory issue in Flink

classic Classic list List threaded Threaded
3 messages Options
Reply | Threaded
Open this post in threaded view
|

Diagnosing high cpu/memory issue in Flink

Pawel Bartoszek

Hi,
I am looking for help with a performance problem I have with Flink 1.3.2, running on 2 task managers on EMR with BEAM 2.2.0. I’ve included details and observations below.


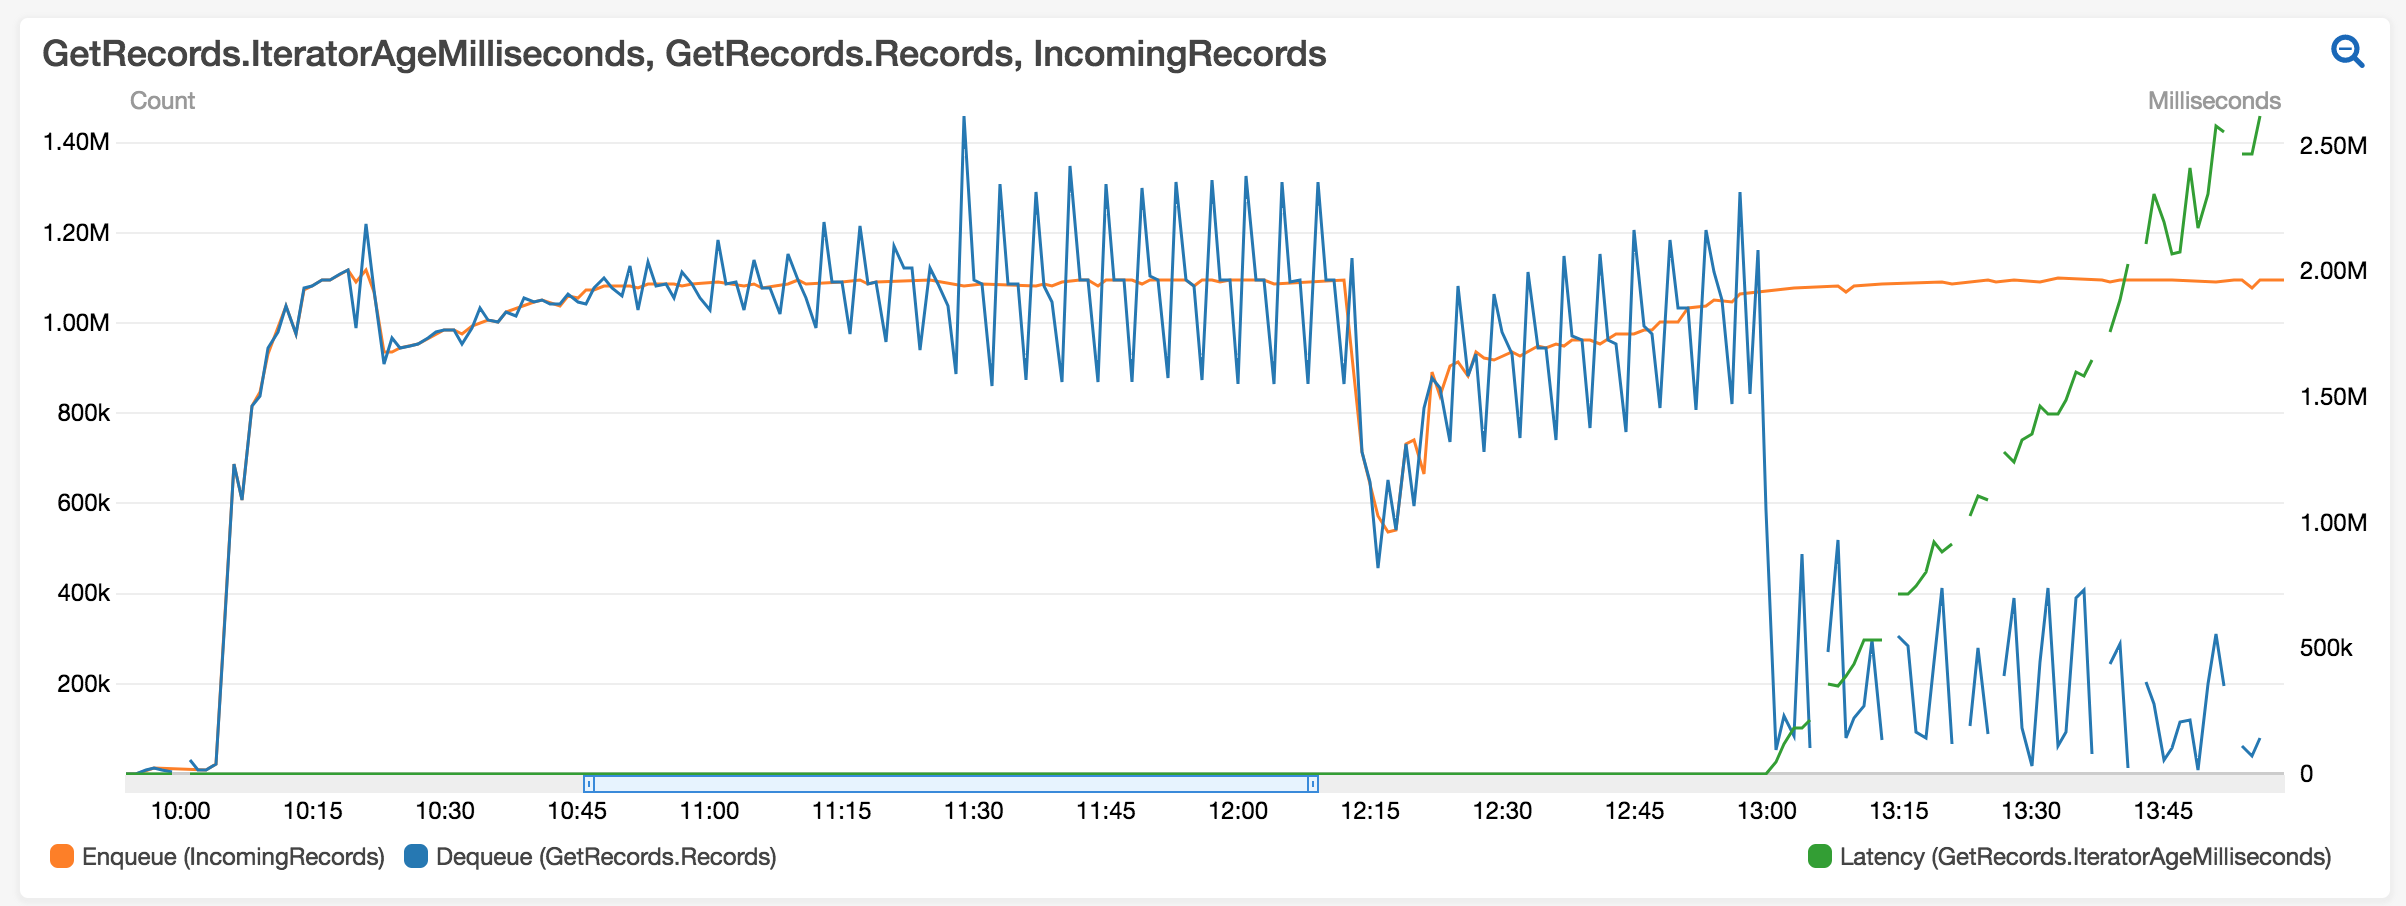
The blue line represents the number of records read from a kinesis stream by the job and the orange line is the number of records pushed to the stream by users. As you can see, after some time the job begins to slow down (around 10 AM) and it breaks completely around 1 PM. The job supports late data for up to 3 hours.


Inline images 3

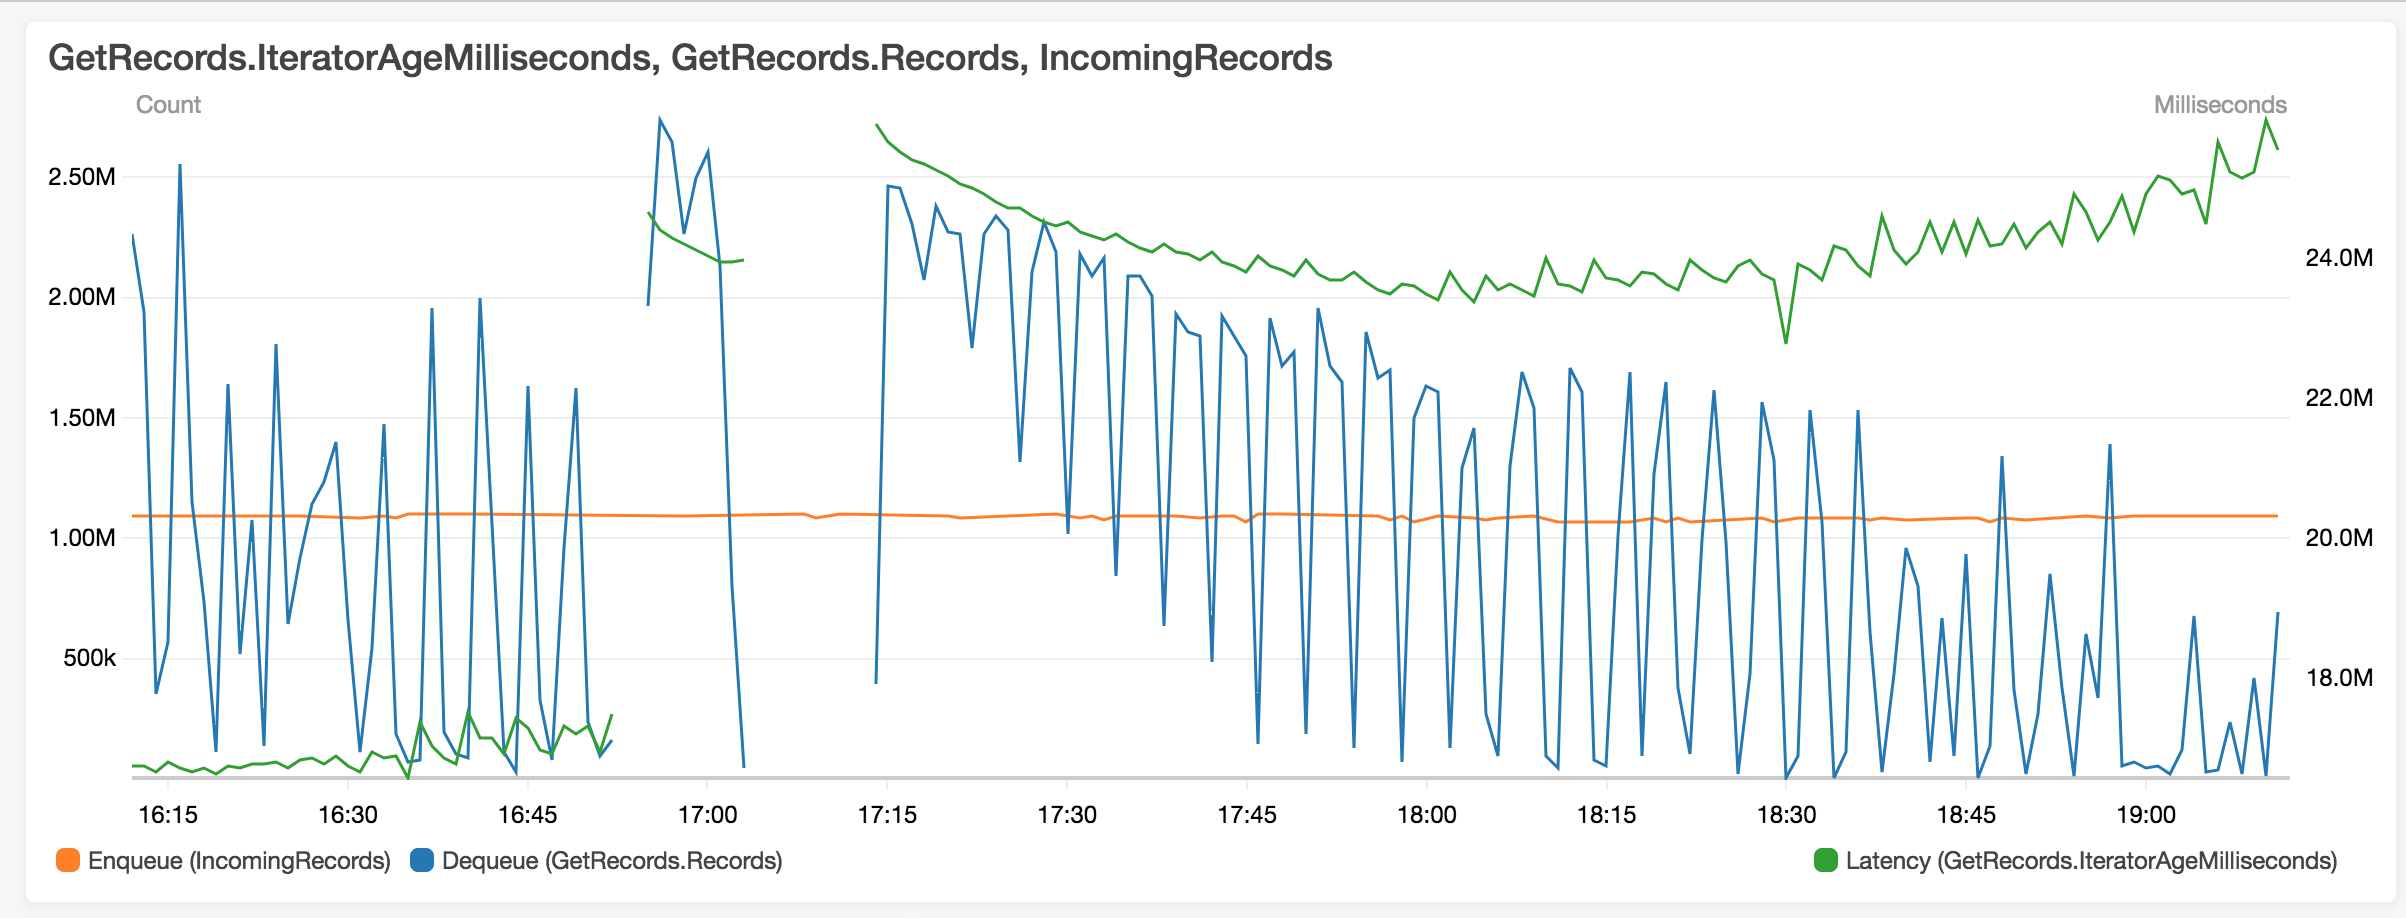
Another example: (dips corresponds to times when checkpointing is in progress) 

Inline images 4


I made some observations:

- The dip along the blue line corresponds to checkpoints being created (every 4 minutes). We use S3 as checkpoint store.  I thought that checkpoints are created asynchronously. Should they impact the performance of the job? The checkpoints are roughly 10GB. 

How do I check that I need to assign more memory to Flink Managed Memory and not to User Managed Memory (taskmanager.memory.fraction) 

- The job is using an allowed lateness of 3 hours and will recompute the result of the given key if that key changes within the allowed lateness period. Does this it mean that Flink will keep in memory my the objects that I created as part of map transformations? I thought  that Flink supports flushing old enough windows to the disk thus freeing up the heap?

- I noticed that the first task manger (see below) is running a lot of more PS_MarkSweep cycles.
Every cycle takes around 6 seconds and the number of gc cycles increases linearly with wobbling on the graph above. When the job literally slows down then the CPU on the task manager is hitting 100%.Is it a reasonable assumption that it's the PS_MarkSweep that is eating up the whole cpu because it needs to scan the whole heap, and it cannot release any memory as it's needed to keep the previous records within the allowed lateness of 3 hours?

- Do you think I could get any better performance using taskmanager.memory.off-heap or GC1 collector?


Tast Manger 1

Memory

JVM (Heap/Non-Heap)

Type Committed Used Maximum
Heap 39.3 GB 33.5 GB 39.3 GB
Non-Heap 162 MB 159 MB -1 B
Total 39.4 GB 33.6 GB 39.3 GB

Outside JVM

Type Count Used Capacity
Direct 158 226 MB 226 MB
Mapped 0 0 B 0 B

Network

Memory Segments

Type Count
Available 8,141
Total 20,480

Garbage Collection

Collector Count Time
PS_Scavenge 1,062 123,240
PS_MarkSweep 36 240,653
Task manager 2

Overview

Data Port All Slots Free Slots CPU Cores Physical Memory JVM Heap Size Flink Managed Memory
39881 16 0 16 62.9 GB 39.3 GB 27.0 GB

Memory

JVM (Heap/Non-Heap)

Type Committed Used Maximum
Heap 40.1 GB 33.4 GB 40.1 GB
Non-Heap 165 MB 161 MB -1 B
Total 40.3 GB 33.6 GB 40.1 GB

Outside JVM

Type Count Used Capacity
Direct 156 226 MB 226 MB
Mapped 0 0 B 0 B

Network

Memory Segments

Type Count
Available 8,727
Total 20,480

Garbage Collection

Collector Count Time
PS_Scavenge 1,204 117,379
PS_MarkSweep 8 26,846

Cheers,

Pawel Bartoszek


Reply | Threaded
Open this post in threaded view
|

Re: Diagnosing high cpu/memory issue in Flink

Kien Truong

Hi Pawel,


If you're not using Rocksdb state backend, try switching to it.

I've had bad experiences with FsStateBackend with large windows,

due to long GC pause when old state need cleaning up.


Best regards,

Kien


On 2/16/2018 2:34 AM, Pawel Bartoszek wrote:

Hi,
I am looking for help with a performance problem I have with Flink 1.3.2, running on 2 task managers on EMR with BEAM 2.2.0. I’ve included details and observations below.


The blue line represents the number of records read from a kinesis stream by the job and the orange line is the number of records pushed to the stream by users. As you can see, after some time the job begins to slow down (around 10 AM) and it breaks completely around 1 PM. The job supports late data for up to 3 hours.


Inline images 3

Another example: (dips corresponds to times when checkpointing is in progress) 

Inline images 4


I made some observations:

- The dip along the blue line corresponds to checkpoints being created (every 4 minutes). We use S3 as checkpoint store.  I thought that checkpoints are created asynchronously. Should they impact the performance of the job? The checkpoints are roughly 10GB. 

How do I check that I need to assign more memory to Flink Managed Memory and not to User Managed Memory (taskmanager.memory.fraction) 

- The job is using an allowed lateness of 3 hours and will recompute the result of the given key if that key changes within the allowed lateness period. Does this it mean that Flink will keep in memory my the objects that I created as part of map transformations? I thought  that Flink supports flushing old enough windows to the disk thus freeing up the heap?

- I noticed that the first task manger (see below) is running a lot of more PS_MarkSweep cycles.
Every cycle takes around 6 seconds and the number of gc cycles increases linearly with wobbling on the graph above. When the job literally slows down then the CPU on the task manager is hitting 100%.Is it a reasonable assumption that it's the PS_MarkSweep that is eating up the whole cpu because it needs to scan the whole heap, and it cannot release any memory as it's needed to keep the previous records within the allowed lateness of 3 hours?

- Do you think I could get any better performance using taskmanager.memory.off-heap or GC1 collector?


Tast Manger 1

Memory

JVM (Heap/Non-Heap)

Type Committed Used Maximum
Heap 39.3 GB 33.5 GB 39.3 GB
Non-Heap 162 MB 159 MB -1 B
Total 39.4 GB 33.6 GB 39.3 GB

Outside JVM

Type Count Used Capacity
Direct 158 226 MB 226 MB
Mapped 0 0 B 0 B

Network

Memory Segments

Type Count
Available 8,141
Total 20,480

Garbage Collection

Collector Count Time
PS_Scavenge 1,062 123,240
PS_MarkSweep 36 240,653
Task manager 2

Overview

Data Port All Slots Free Slots CPU Cores Physical Memory JVM Heap Size Flink Managed Memory
39881 16 0 16 62.9 GB 39.3 GB 27.0 GB

Memory

JVM (Heap/Non-Heap)

Type Committed Used Maximum
Heap 40.1 GB 33.4 GB 40.1 GB
Non-Heap 165 MB 161 MB -1 B
Total 40.3 GB 33.6 GB 40.1 GB

Outside JVM

Type Count Used Capacity
Direct 156 226 MB 226 MB
Mapped 0 0 B 0 B

Network

Memory Segments

Type Count
Available 8,727
Total 20,480

Garbage Collection

Collector Count Time
PS_Scavenge 1,204 117,379
PS_MarkSweep 8 26,846

Cheers,

Pawel Bartoszek


Reply | Threaded
Open this post in threaded view
|

Re: Diagnosing high cpu/memory issue in Flink

Till Rohrmann
Hi Pawel,

given your description it could perfectly be the case that you're running into GC problems. As Kien suggested, you should use the RocksDBStateBackend if you're dealing with a lot of state. This state backend is the only one which supports spilling right now. Moreover, you should make sure to enable asynchronous checkpoints. Otherwise checkpoints might decrease performance of your job.

Cheers,
Till

On Sat, Feb 17, 2018 at 2:45 PM, Kien Truong <[hidden email]> wrote:

Hi Pawel,


If you're not using Rocksdb state backend, try switching to it.

I've had bad experiences with FsStateBackend with large windows,

due to long GC pause when old state need cleaning up.


Best regards,

Kien


On 2/16/2018 2:34 AM, Pawel Bartoszek wrote:

Hi,
I am looking for help with a performance problem I have with Flink 1.3.2, running on 2 task managers on EMR with BEAM 2.2.0. I’ve included details and observations below.


The blue line represents the number of records read from a kinesis stream by the job and the orange line is the number of records pushed to the stream by users. As you can see, after some time the job begins to slow down (around 10 AM) and it breaks completely around 1 PM. The job supports late data for up to 3 hours.


Inline images 3

Another example: (dips corresponds to times when checkpointing is in progress) 

Inline images 4


I made some observations:

- The dip along the blue line corresponds to checkpoints being created (every 4 minutes). We use S3 as checkpoint store.  I thought that checkpoints are created asynchronously. Should they impact the performance of the job? The checkpoints are roughly 10GB. 

How do I check that I need to assign more memory to Flink Managed Memory and not to User Managed Memory (taskmanager.memory.fraction) 

- The job is using an allowed lateness of 3 hours and will recompute the result of the given key if that key changes within the allowed lateness period. Does this it mean that Flink will keep in memory my the objects that I created as part of map transformations? I thought  that Flink supports flushing old enough windows to the disk thus freeing up the heap?

- I noticed that the first task manger (see below) is running a lot of more PS_MarkSweep cycles.
Every cycle takes around 6 seconds and the number of gc cycles increases linearly with wobbling on the graph above. When the job literally slows down then the CPU on the task manager is hitting 100%.Is it a reasonable assumption that it's the PS_MarkSweep that is eating up the whole cpu because it needs to scan the whole heap, and it cannot release any memory as it's needed to keep the previous records within the allowed lateness of 3 hours?

- Do you think I could get any better performance using taskmanager.memory.off-heap or GC1 collector?


Tast Manger 1

Memory

JVM (Heap/Non-Heap)

Type Committed Used Maximum
Heap 39.3 GB 33.5 GB 39.3 GB
Non-Heap 162 MB 159 MB -1 B
Total 39.4 GB 33.6 GB 39.3 GB

Outside JVM

Type Count Used Capacity
Direct 158 226 MB 226 MB
Mapped 0 0 B 0 B

Network

Memory Segments

Type Count
Available 8,141
Total 20,480

Garbage Collection

Collector Count Time
PS_Scavenge 1,062 123,240
PS_MarkSweep 36 240,653
Task manager 2

Overview

Data Port All Slots Free Slots CPU Cores Physical Memory JVM Heap Size Flink Managed Memory
39881 16 0 16 62.9 GB 39.3 GB 27.0 GB

Memory

JVM (Heap/Non-Heap)

Type Committed Used Maximum
Heap 40.1 GB 33.4 GB 40.1 GB
Non-Heap 165 MB 161 MB -1 B
Total 40.3 GB 33.6 GB 40.1 GB

Outside JVM

Type Count Used Capacity
Direct 156 226 MB 226 MB
Mapped 0 0 B 0 B

Network

Memory Segments

Type Count
Available 8,727
Total 20,480

Garbage Collection

Collector Count Time
PS_Scavenge 1,204 117,379
PS_MarkSweep 8 26,846

Cheers,

Pawel Bartoszek