Default Flink Metrics Graphite

Default Flink Metrics Graphite

|
Hi Team,
I am trying to export Flink stream default metrics using Graphite, but I can't find it in the Graphite metrics console. Could you confirm the steps below are correct? 1) Updated flink-conf.yaml metrics.reporter.grph.factory.class: org.apache.flink.metrics.graphite.GraphiteReporterFactory metrics.reporter.grph.host: port metrics.reporter.grph.port: 9109 metrics.reporter.grph.protocol: TCP metrics.reporter.grph.interval: 30 SECONDS 2) Added Graphite jar in plugin folder : ll /usr/lib/flink/plugins/metric/ flink-metrics-graphite-1.10.0.jar 3) Looking metrics in graphite server: Note: No code change is done. Regards, Vijay |
Re: Default Flink Metrics Graphite
|
|
Hi Vijay, Your steps look correct to me. Perhaps you can double check that the graphite port you are sending is correct? THe default carbon port is 2003 and if you use the aggregator it is 2023. You should be able to see in both flink jobmanager and taskmanager that the metrics have been initialized with the config you have pasted. Regards ,Nikola Hrusov On Mon, Aug 24, 2020 at 5:00 AM Vijayendra Yadav <[hidden email]> wrote:
|
Re: Default Flink Metrics Graphite
|
|
Thanks for inputs Nikola. I will check on graphite side.
Sent from my iPhone On Aug 23, 2020, at 9:26 PM, Nikola Hrusov <[hidden email]> wrote:
|
Re: Default Flink Metrics Graphite
|
|
In reply to this post by Nikola Hrusov
Hi Nikola, To rule out any other cluster issues, I have tried it in my local now. Steps as follows, but don't see any metrics yet. 1) Set up local Graphite Mapped Ports
2) WebUI: 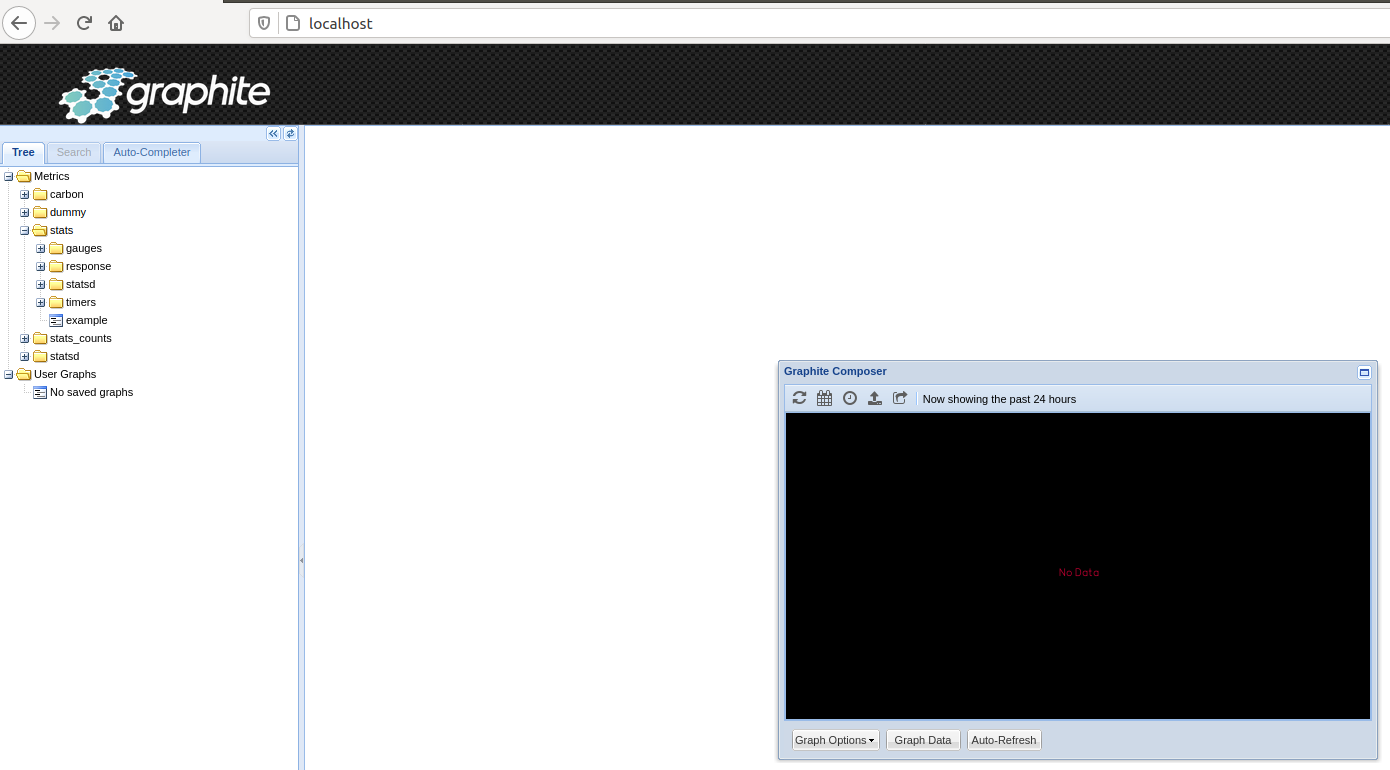 3) Run Flink example Job. ./bin/flink run ./examples/flink-examples-streaming_2.11-1.11-SNAPSHOT-SocketWindowWordCount.jar --port 9999 with conf/flink-conf.yaml set as: metrics.reporter.grph.factory.class: org.apache.flink.metrics.graphite.GraphiteReporterFactory metrics.reporter.grph.host: localhost metrics.reporter.grph.port: 2003 metrics.reporter.grph.protocol: TCP metrics.reporter.grph.interval: 1 SECONDS and graphite jar: plugins/flink-metrics-graphite/flink-metrics-graphite-1.10.0.jar 4) Can't see any activity in webui graphite. Could you review and let me know what is wrong here ? any other way you suggest to be able to view the raw metrics data ? Also, do you have sample metrics raw format, you can share from any other project. Regards, Vijay On Sun, Aug 23, 2020 at 9:26 PM Nikola Hrusov <[hidden email]> wrote:
|
Re: Default Flink Metrics Graphite
|
|
Hi Vijay, I think the problem might be that you are using a wrong version of the reporter. You say you used flink-metrics-graphite-1.10.0.jar from 1.10 as a plugin, but it was migrated to plugins in 1.11 only[1]. I'd recommend trying it out with the same 1.11 version of Flink and Graphite reporter. Best, Dawid [1] https://issues.apache.org/jira/browse/FLINK-16965 On 26/08/2020 08:04, Vijayendra Yadav
wrote:
|

Re: Default Flink Metrics Graphite
|
|
Hi Dawid,
I have 1.10.0 version of flink. What is alternative for this version ? Regards, Vijay
|
Re: Default Flink Metrics Graphite
|
|
I'd recommend then following this instruction from older docs[1] The difference are that you should set: and put the reporter jar to the /lib folder: In order to use this reporter you must copy Best, Dawid On 26/08/2020 16:40, Vijayendra Yadav
wrote:
Hi Dawid, |
Re: Default Flink Metrics Graphite
|
|
In reply to this post by Vijayendra Yadav
metrics.reporter.grph.class:
org.apache.flink.metrics.graphite.GraphiteReporter
On 26/08/2020 16:40, Vijayendra Yadav
wrote:
Hi Dawid,
|
Re: Default Flink Metrics Graphite
|
|
Hi Chesnay and Dawid, I see multiple entries as following in Log: 2020-08-26 23:46:19,105 WARN org.apache.flink.runtime.metrics.MetricRegistryImpl - Error while registering metric: numRecordsIn. java.lang.IllegalArgumentException: A metric named ip-99-9999-99-99.taskmanager.container_1596056409708_1570_01_000006.vdcs-kafka-flink-test.Map.0.numRecordsIn already exists at com.codahale.metrics.MetricRegistry.register(MetricRegistry.java:91) 2020-08-26 23:46:19,094 WARN org.apache.flink.runtime.metrics.MetricRegistryImpl - Error while registering metric: numRecordsOut. java.lang.IllegalArgumentException: A metric named ip-99-9999-99-999.taskmanager.container_1596056409708_1570_01_000005.vdcs-kafka-flink-test.Map.2.numRecordsOut already exists at com.codahale.metrics.MetricRegistry.register(MetricRegistry.java:91) at org.apache.flink.dropwizard.ScheduledDropwizardReporter.notifyOfAddedMetric(ScheduledDropwizardReporter.java:131) at com.codahale.metrics.MetricRegistry.register(MetricRegistry.java:91) at org.apache.flink.dropwizard.ScheduledDropwizardReporter.notifyOfAddedMetric(ScheduledDropwizardReporter.java:131) at org.apache.flink.runtime.metrics.MetricRegistryImpl.register(MetricRegistryImpl.java:343) at org.apache.flink.runtime.metrics.groups.AbstractMetricGroup.addMetric(AbstractMetricGroup.java:426) at org.apache.flink.runtime.metrics.groups.AbstractMetricGroup.counter(AbstractMetricGroup.java:359) at org.apache.flink.runtime.metrics.groups.AbstractMetricGroup.counter(AbstractMetricGroup.java:349) at org.apache.flink.runtime.metrics.groups.OperatorIOMetricGroup.<init>(OperatorIOMetricGroup.java:41) at org.apache.flink.runtime.metrics.groups.OperatorMetricGroup.<init>(OperatorMetricGroup.java:48) at org.apache.flink.runtime.metrics.groups.TaskMetricGroup.lambda$getOrAddOperator$0(TaskMetricGroup.java:154) at java.util.HashMap.computeIfAbsent(HashMap.java:1127) at org.apache.flink.runtime.metrics.groups.TaskMetricGroup.getOrAddOperator(TaskMetricGroup.java:154) at org.apache.flink.streaming.api.operators.AbstractStreamOperator.setup(AbstractStreamOperator.java:180) at org.apache.flink.streaming.api.operators.AbstractUdfStreamOperator.setup(AbstractUdfStreamOperator.java:82) at org.apache.flink.streaming.api.operators.SimpleOperatorFactory.createStreamOperator(SimpleOperatorFactory.java:75) at org.apache.flink.streaming.api.operators.StreamOperatorFactoryUtil.createOperator(StreamOperatorFactoryUtil.java:48) at org.apache.flink.streaming.runtime.tasks.OperatorChain.createChainedOperator(OperatorChain.java:429) at org.apache.flink.streaming.runtime.tasks.OperatorChain.createOutputCollector(OperatorChain.java:353) at org.apache.flink.streaming.runtime.tasks.OperatorChain.<init>(OperatorChain.java:144) at org.apache.flink.streaming.runtime.tasks.StreamTask.beforeInvoke(StreamTask.java:433) at org.apache.flink.streaming.runtime.tasks.StreamTask.invoke(StreamTask.java:461) at org.apache.flink.runtime.taskmanager.Task.doRun(Task.java:707) at org.apache.flink.runtime.taskmanager.Task.run(Task.java:532) at java.lang.Thread.run(Thread.java:748) Regards, Vijay On Wed, Aug 26, 2020 at 7:53 AM Chesnay Schepler <[hidden email]> wrote:
|
|
|
I don't think these error messages give us a hint why you can't see the metrics (because they are about registering metrics, not reporting them) Are you sure you are using the right configuration parameters for Flink 1.10? That all required JARs are in the lib/ folder (on all machines) and that your graphite setup is working (have you confirmed that you can show any metrics in the Graphite UI (maybe from a Graphite demo thingy))? On Thu, Aug 27, 2020 at 2:05 AM Vijayendra Yadav <[hidden email]> wrote:
|
Re: Default Flink Metrics Graphite
|
|
Thanks all, I could see the metrics. On Thu, Aug 27, 2020 at 7:51 AM Robert Metzger <[hidden email]> wrote:
|
Re: Default Flink Metrics Graphite
|
|
Hi Vijayendra, what was the problem in the end? Sharing this knowledge might help other community member who might run into the same issue. Cheers, Till On Wed, Sep 2, 2020 at 3:34 AM Vijayendra Yadav <[hidden email]> wrote:
|
Re: Default Flink Metrics Graphite
|
|
Hi Till, Info below, also I have a question at the end. pretty much what was told earlier, for 1.10.0 use: metrics.reporter.grph.class: org.apache.flink.metrics.graphite.GraphiteReporter And then Looks like my Graphite installation has a problem or I am missing something. Just to make sure Flink exporter has no problem I set up graphite exporter config to local host and port 8888 and then i started listening to port using netcat and I was able to see metrics: vy0769@ubuntu:~/IdeaProjects/vdcs-kafka-flink-ingestion$ nc -lv -p 8888 Listening on [0.0.0.0] (family 0, port 8888) localhost.jobmanager.Socket-Window-WordCount.downtime 0 1599063945 localhost.jobmanager.Socket-Window-WordCount.fullRestarts 0 1599063945 localhost.jobmanager.Socket-Window-WordCount.lastCheckpointAlignmentBuffered -1 1599063945 I have a Question above:
There two values say:
0 1599063945. Is value 1599063945 the Timestamp ? Regards, Vijay On Wed, Sep 2, 2020 at 2:06 AM Till Rohrmann <[hidden email]> wrote:
|
Re: Default Flink Metrics Graphite
|
|
Hi Vijay, yes the last value is the timestamp when this value was sent to Graphite. Cheers, Till On Wed, Sep 2, 2020 at 6:39 PM Vijayendra Yadav <[hidden email]> wrote:
|
| Free forum by Nabble | Edit this page |