Can someone explain memory usage in a flink worker?
Can someone explain memory usage in a flink worker?
|
Hi,
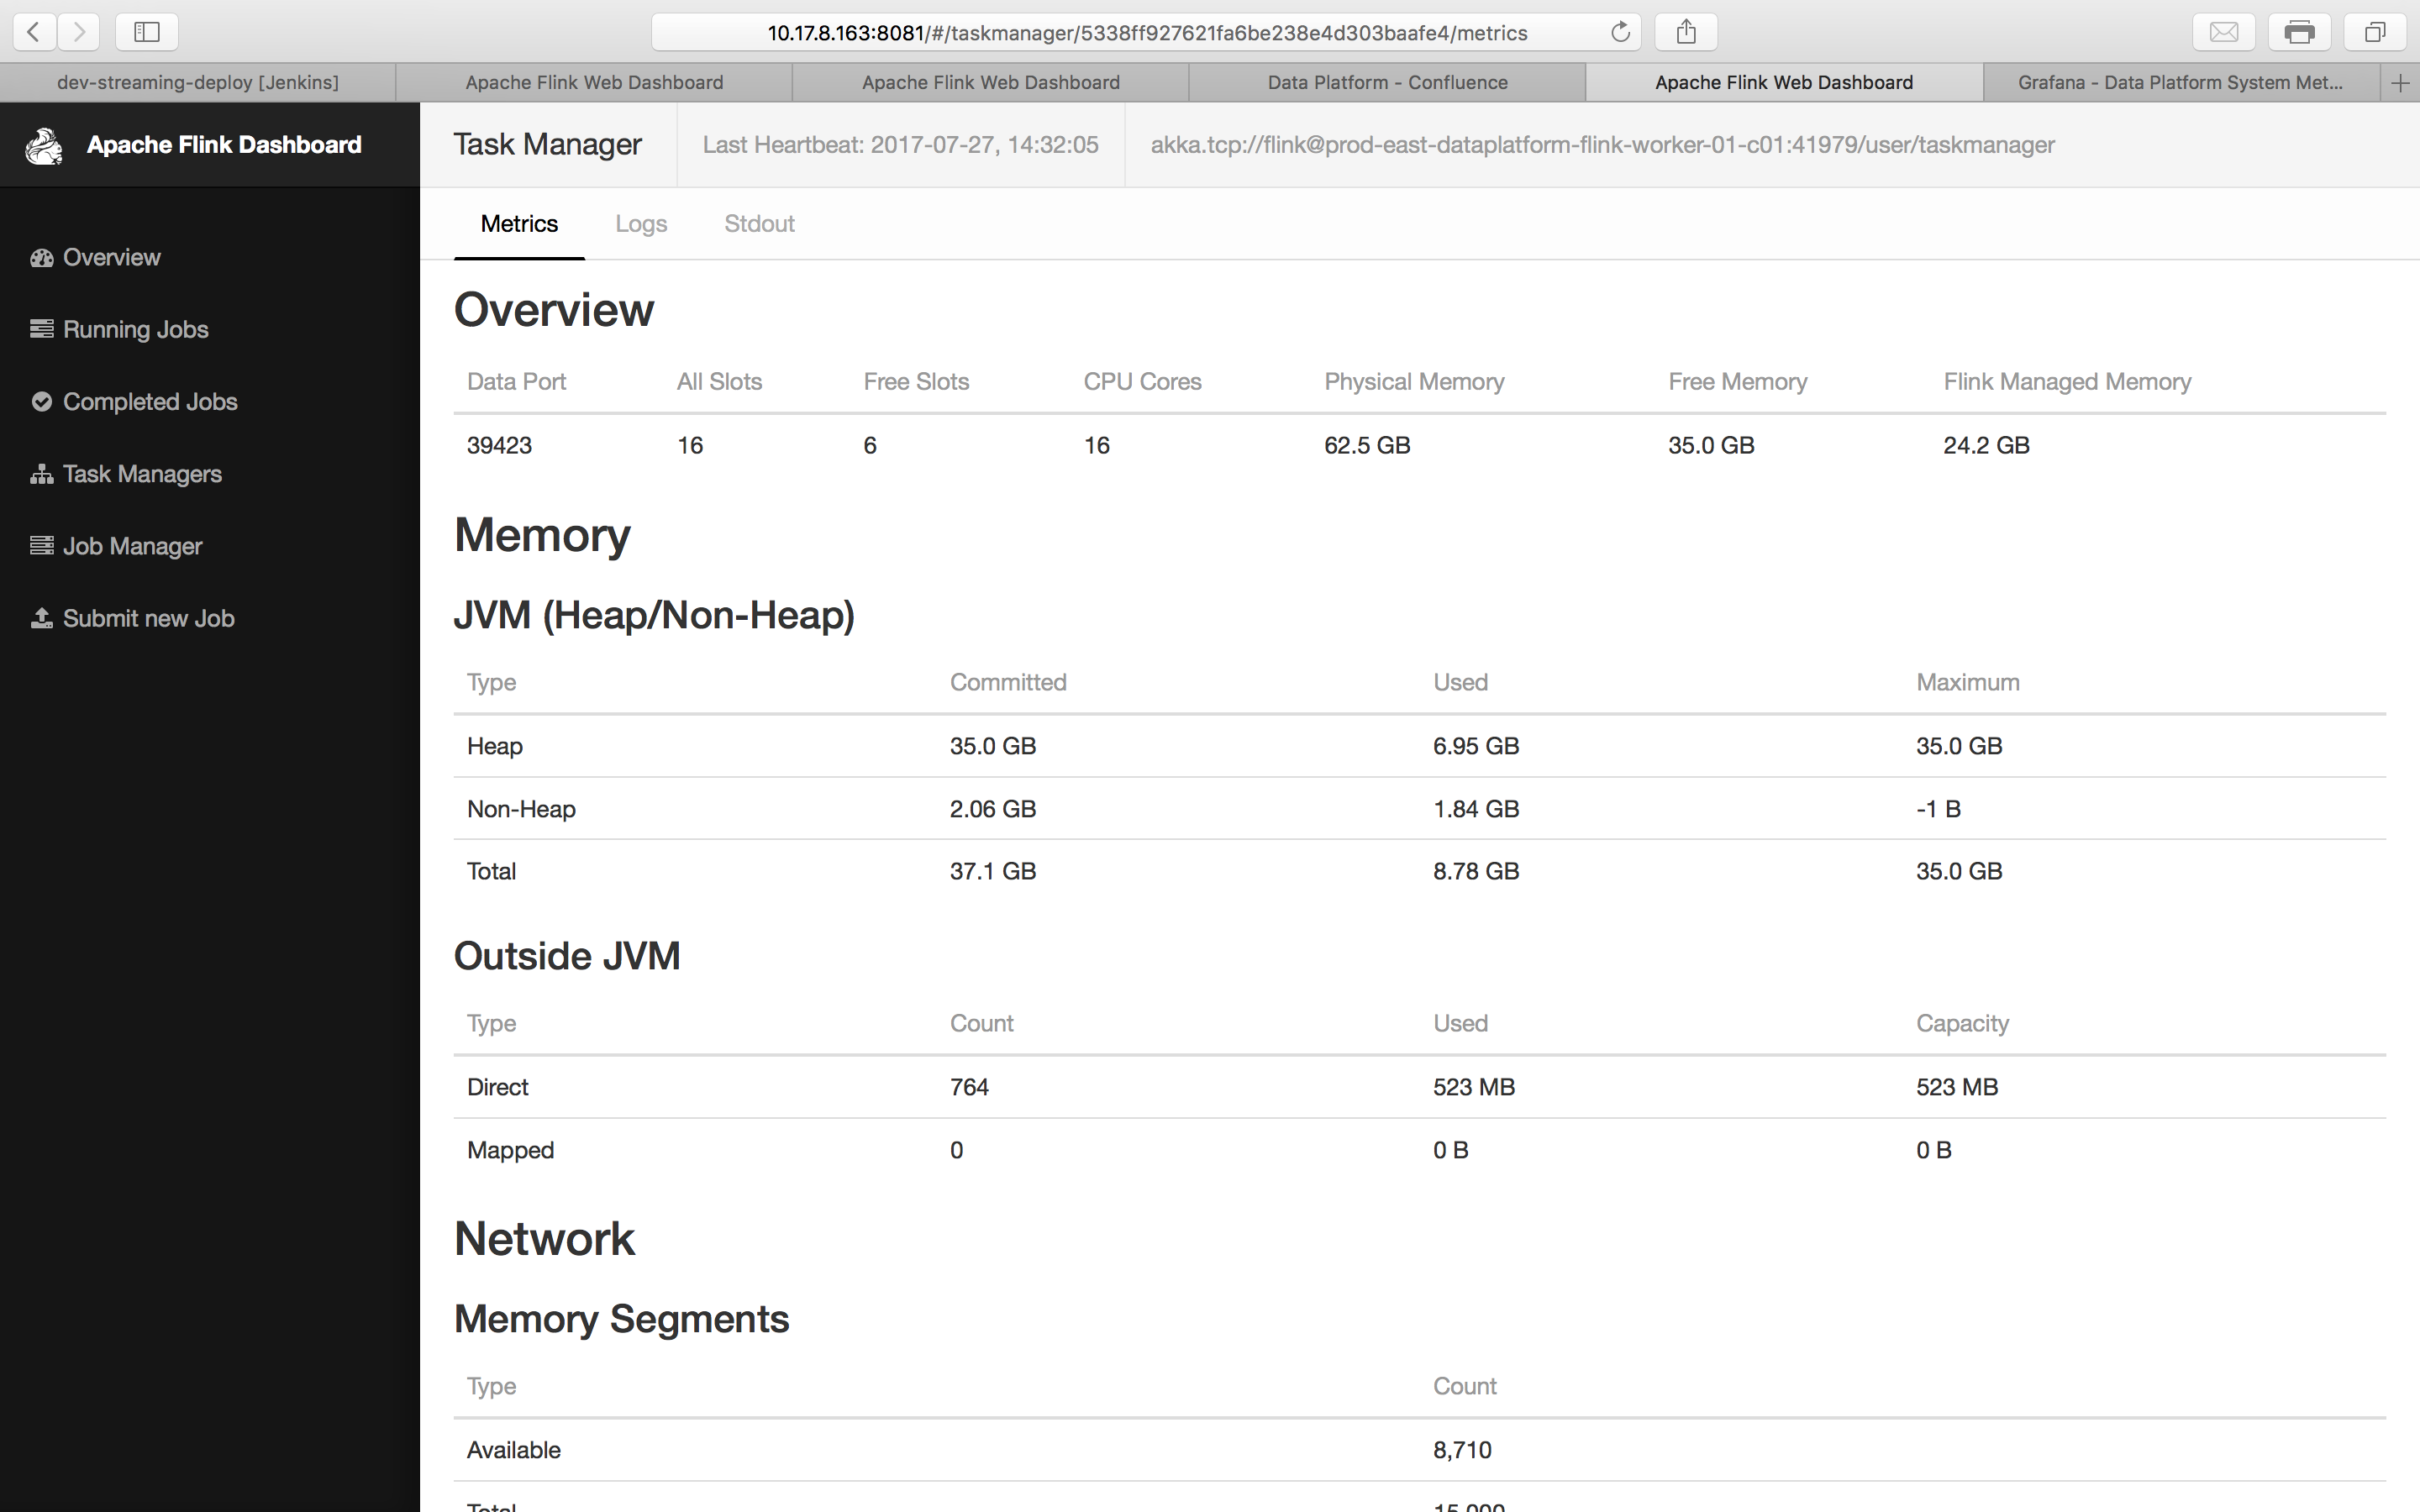
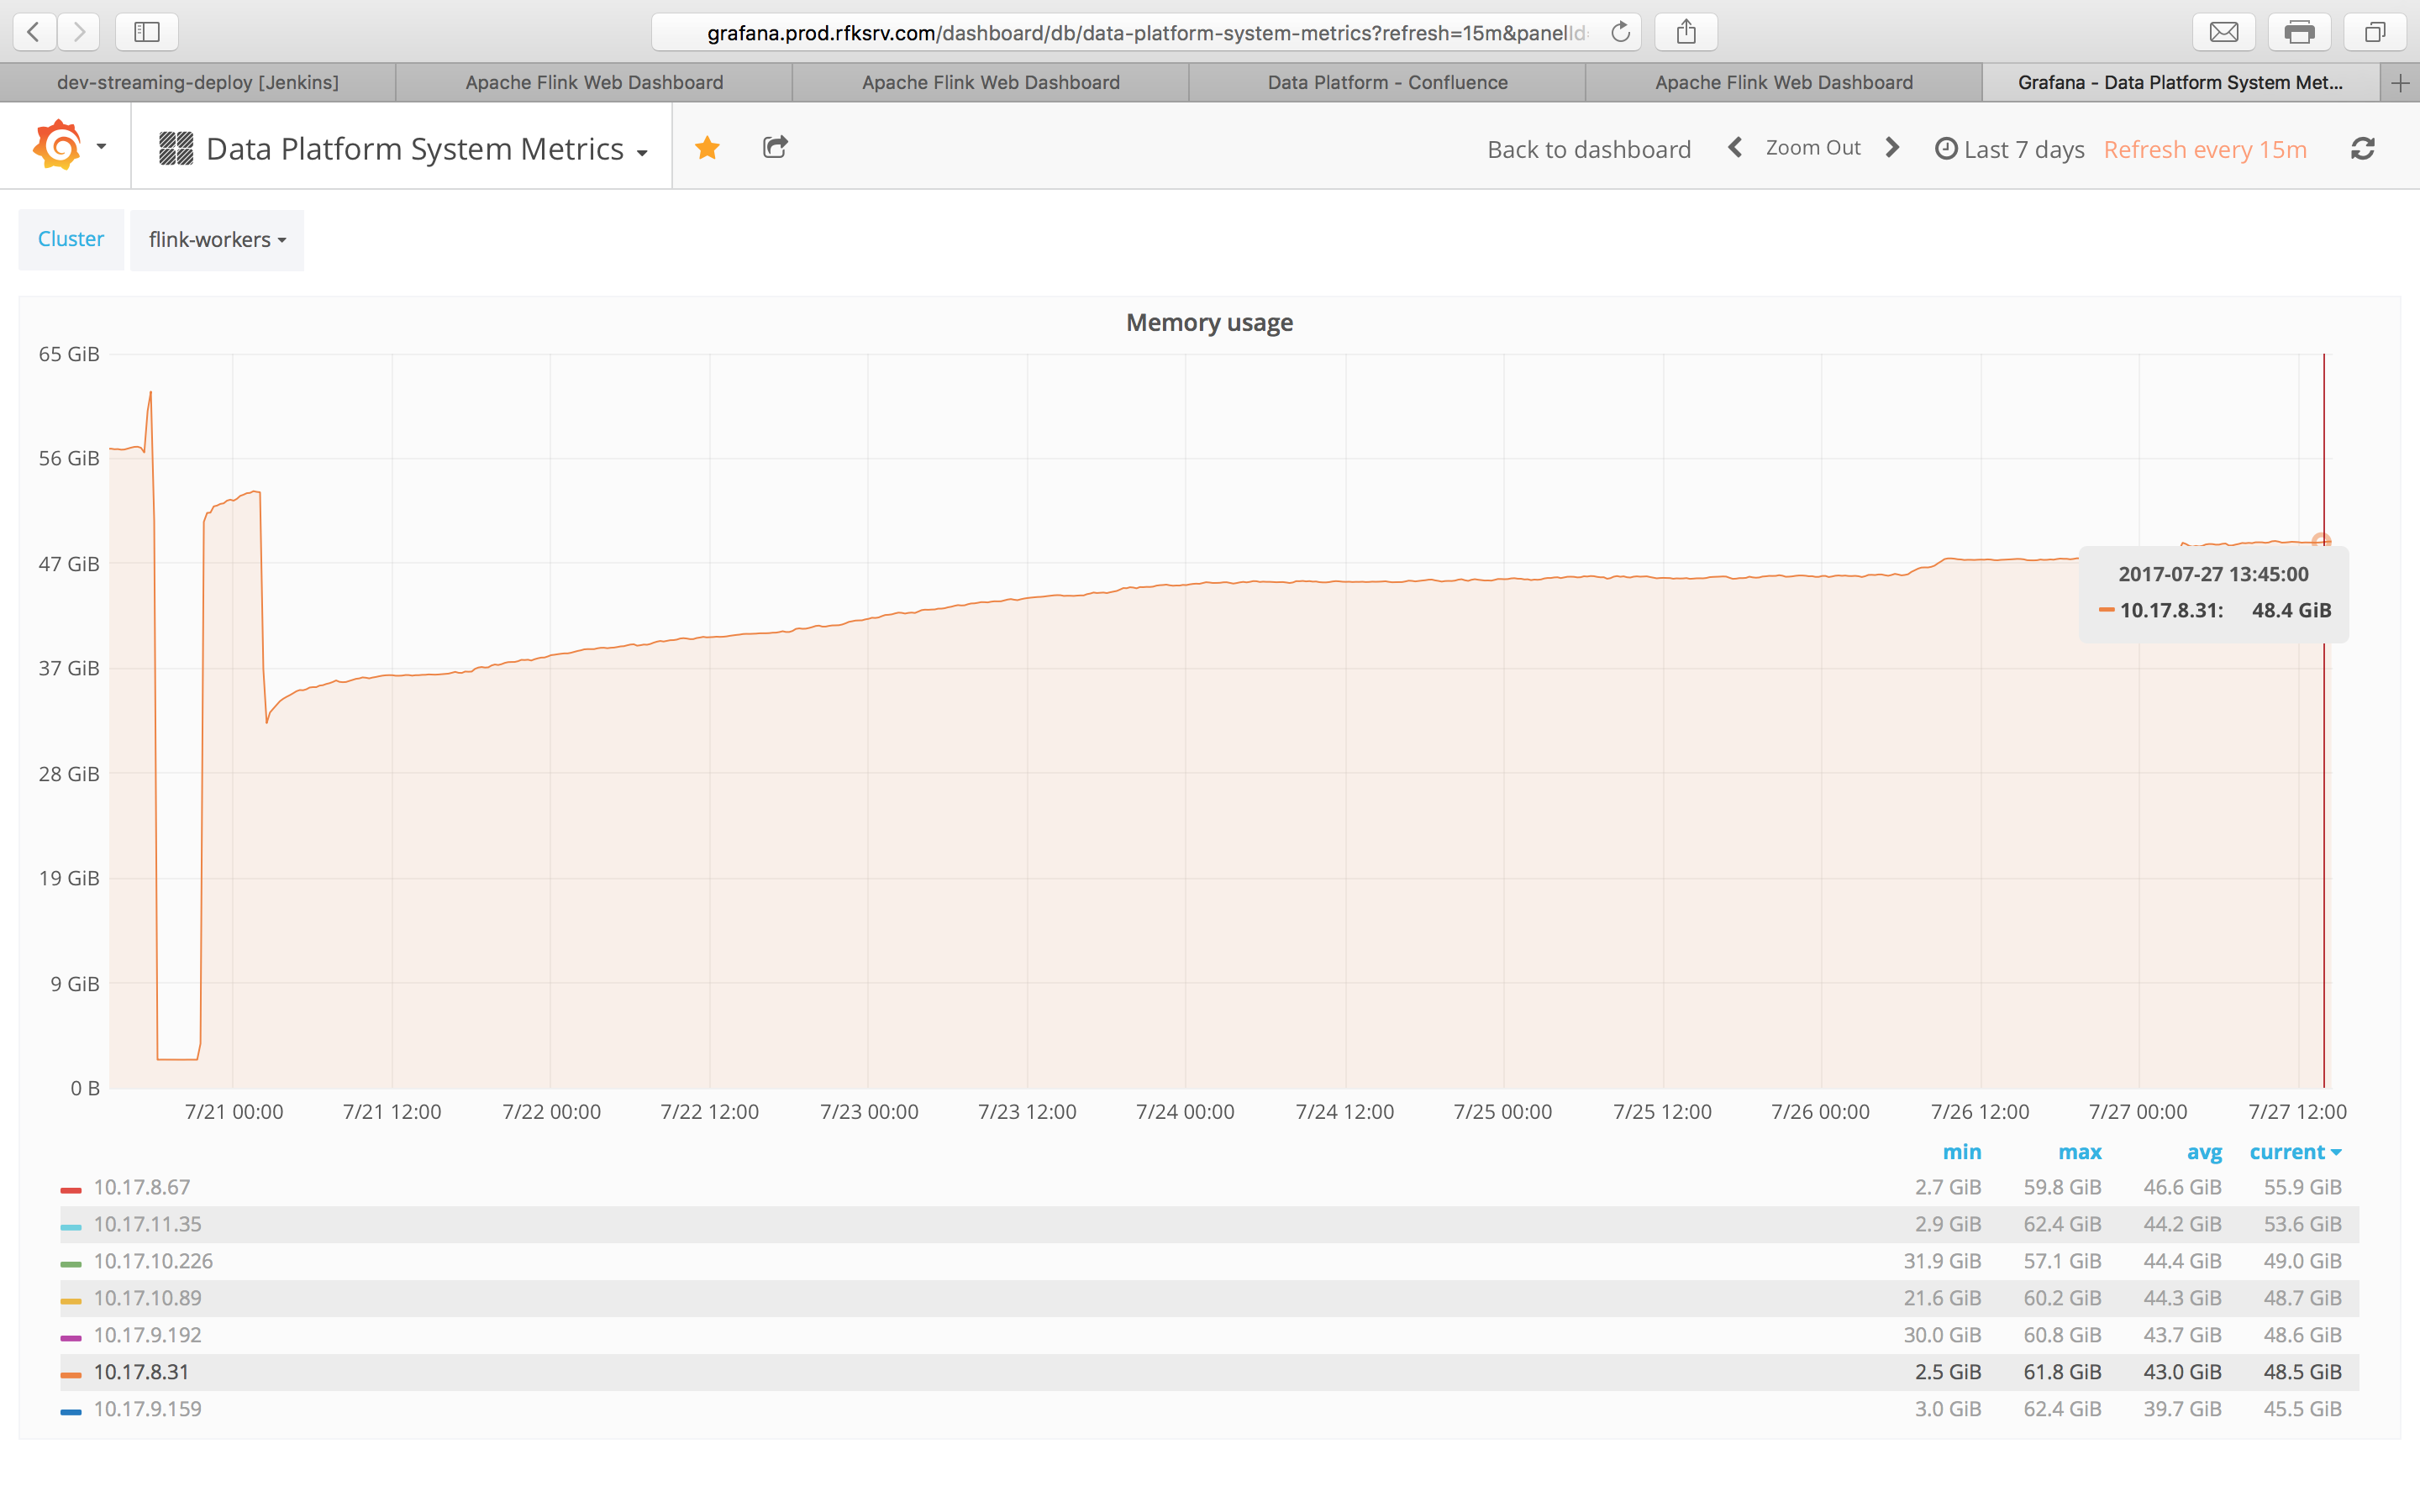
I have a setup of 7 task managers, each with 64GB of physical memory out of which I have allocated 35GB as task manager’s heap memory. I am using rocksdb as state backend. I see a lot of anomalies in the reports generated by the Flink-UI vs my system metrics. Can someone please help explaining what is happening here. - Why does the flink-ui shows 35 GB as free memory when the system has currently occupied 48.4 GB of memory, which leaves only (62.5-48.4)14.1 GB free. - Where is the memory used by RocksDb displayed? The machine does not do anything except serving as the flink worker, so can I assume that 62.5 GB - 35 GB - 14.1 Gb - 523MB = 12.9 GB is the memory used by RocksDb? When I do `ps -ef | grep rocksdb` I don’t see any process running, is this normal? - Also, my system metrics shows that the memory usage keeps on increasing until the task-manager itself gets killed but when I see in the Flink-Ui I always see lot of free memory. I am using the default configuration so I don’t think flink managed memory occupies non-heap memory. I am not able to figure out where does this ever-increasing memory consumption is coming from, my guess is this is used by RocksDb. FLINK-UI  SYSTEM METRICS  Thanks in advance. Shashwat
|
Re: Can someone explain memory usage in a flink worker?
|
I also faced annoying problems with Flink memory and TMs killed by the OS because of OOM.
To limit somehow the memory consumption of TM on a single job I do the following: Add to flink.yaml
Edit taskmanager.sh
However, the TM memory continuosly grows one job after the other..it seems that Flink doesn't free all the memory somehow (but I don't know where). I hope this helps, Flavio On Thu, Jul 27, 2017 at 11:29 AM, Shashwat Rastogi <[hidden email]> wrote:
|
Re: Can someone explain memory usage in a flink worker?
|
Hi Shashwat!
The issues and options mentioned by Flavio have nothing to do with the above reported situation. There may be some issue in Netty, but at this point it might as well be that a library or input format used in the user code has a memory leak, so not sure if we can blame Netty there, yet. Here are some other thoughts: - The "Free Memory" is a wrong label (you are probably using an older version of Flink), it is now correctly called "JVM Heap Size". Hence the confusion ;-) - There is no separate RocksDB process - RocksDB is an embedded library, its memory consumption contributes to the JVM process memory size, but not to the heap (and also not the "direct" memory). It simply consumes native process memory. There is no easy way to limit that, so RocksDB may grow indefinitely, if you allow it to. - What you can do is limit the size that RocksDB may take, have a look at the following two classes to see how to configure the RocksDB memory footprint: => org.apache.flink.contrib. => org.apache.flink.contrib. - The managed memory of Flink is used in Batch (DataSet) - in Streaming (DataStream), RocksDB is effectively the managed off-heap memory. As you experienced, RocksDB has a bit of a memory behavior of its own. We are looking to auto-configure that better, see: https://issues.apache.org/jira/browse/FLINK-7289 Hope that helps, Stephan On Thu, Jul 27, 2017 at 12:21 PM, Flavio Pompermaier <[hidden email]> wrote:
|
«
Return to (DEPRECATED) Apache Flink User Mailing List archive.
|
1 view|%1 views
| Free forum by Nabble | Edit this page |


