Aggregate turns MB into GB
|
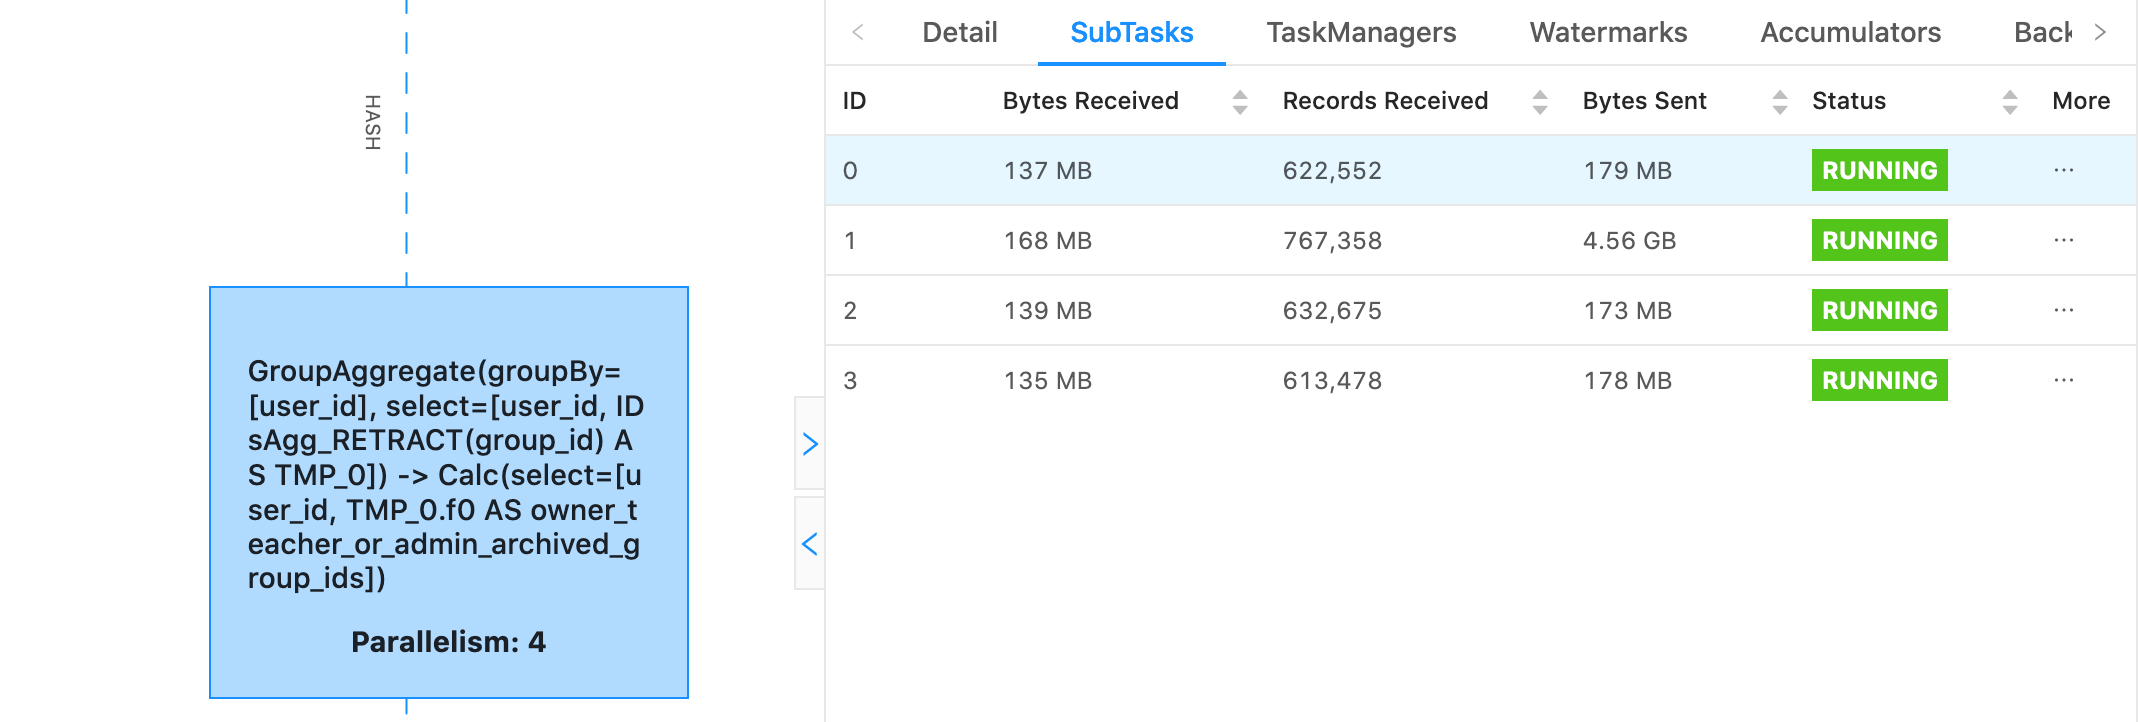
Hello, We noticed that part of our job is producing some really strange skew  Even though subtask 1 has received hardly any more records than the rest of the subtasks, it's sent GB of data where the others have sent hundreds of MB. What's worse is, as that data passes through the graph its size seems to continue to applify at a much higher rate than the data from the other subtasks. We can see this because in the next operator 1 subtask has 4.5 GB of data jumping to 18 GB of data. What could possibly be causing this? That Aggregate Function in use essentially looks like the following, where it aggregates a set of member_ids for group_ids. table.groupBy($"group_id") .aggregate( new IDsAgg()( $"member_id" ) as ("member_ids") ) .select($"group_id", $"member_ids") case class IDsAcc( var IDs: mutable.Set[Long] ) class IDsAgg extends AggregateFunction[Row, IDsAcc] { override def createAccumulator(): IDsAcc = IDsAcc(mutable.Set()) def accumulate( acc: IDsAcc, ID: Long ): Unit = { acc.IDs.add(ID) } def retract(acc: IDsAcc, ID: Long): Unit = { acc.IDs.remove(ID) } def resetAccumulator(acc: IDsAcc): Unit = { acc.IDs = mutable.Set() } override def getValue(acc: IDsAcc): Row = { Row.of(acc.IDs.toArray) } override def getResultType: TypeInformation[Row] = { new RowTypeInfo( createTypeInformation[Array[Long]] ) } } Thanks! -- Rex Fenley | Software Engineer - Mobile and Backend Remind.com | BLOG | FOLLOW US | LIKE US |
|
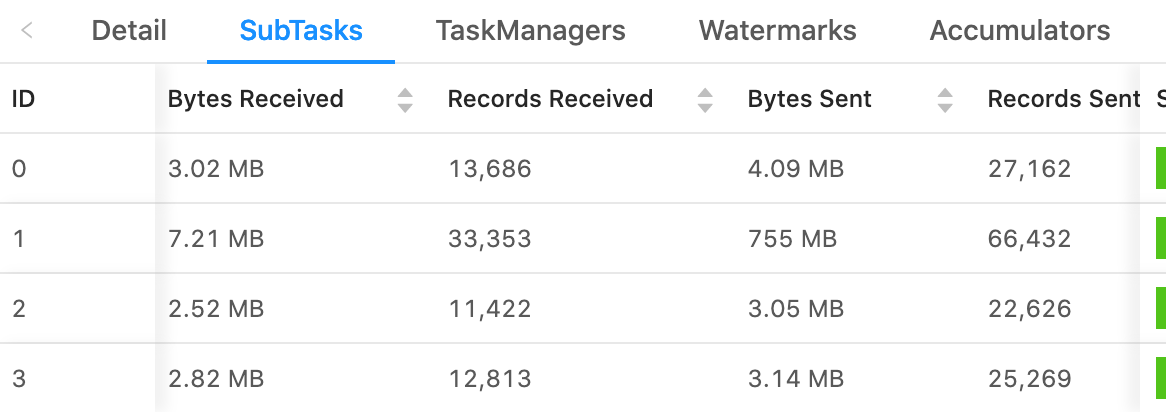
What's odd here too, is the number of records sent does not increase in proportion with the rise in bytes sent. Here's another example demonstrating with records sent.  On Sat, Jan 16, 2021 at 6:33 PM Rex Fenley <[hidden email]> wrote:
-- Rex Fenley | Software Engineer - Mobile and Backend Remind.com | BLOG | FOLLOW US | LIKE US |
|
Hi Rex, I'd guess you have a super-large group in your data. I often see similar things if you use a special value to encode no group (like null) and forgot to filter before that. I'd encourage you to just print a histogram over group sizes and inspect that. On Sun, Jan 17, 2021 at 7:46 AM Rex Fenley <[hidden email]> wrote:
-- Arvid Heise | Senior Java Developer Follow us @VervericaData -- Join Flink Forward - The Apache Flink Conference Stream Processing | Event Driven | Real Time -- Ververica GmbH | Invalidenstrasse 115, 10115 Berlin, Germany -- Ververica GmbHRegistered at Amtsgericht Charlottenburg: HRB 158244 B Managing Directors: Timothy Alexander Steinert, Yip Park Tung Jason, Ji (Toni) Cheng |
|
Thanks for the tip. I tried inspecting from our sink, Elasticsearch, directly for that aggregate's output. "query": { "bool": { "filter": { "script": { "script": { "source": "doc[\u0027owner_teacher_or_admin_archived_group_ids\u0027].size() > 1500", "lang": "painless" } } } } } And I only get back one hit larger than 1500 with a size of ~2000 ids. We do expect to get into the 10s of thousands but not until later in the year so this is what we expected. I can't imagine that only 2000 ids would take up so much space for an aggregate! Is there a way to inspect RocksDB directly to do some analysis? Thanks! On Sun, Jan 17, 2021 at 2:33 AM Arvid Heise <[hidden email]> wrote:
-- Rex Fenley | Software Engineer - Mobile and Backend Remind.com | BLOG | FOLLOW US | LIKE US |
| Free forum by Nabble | Edit this page |


